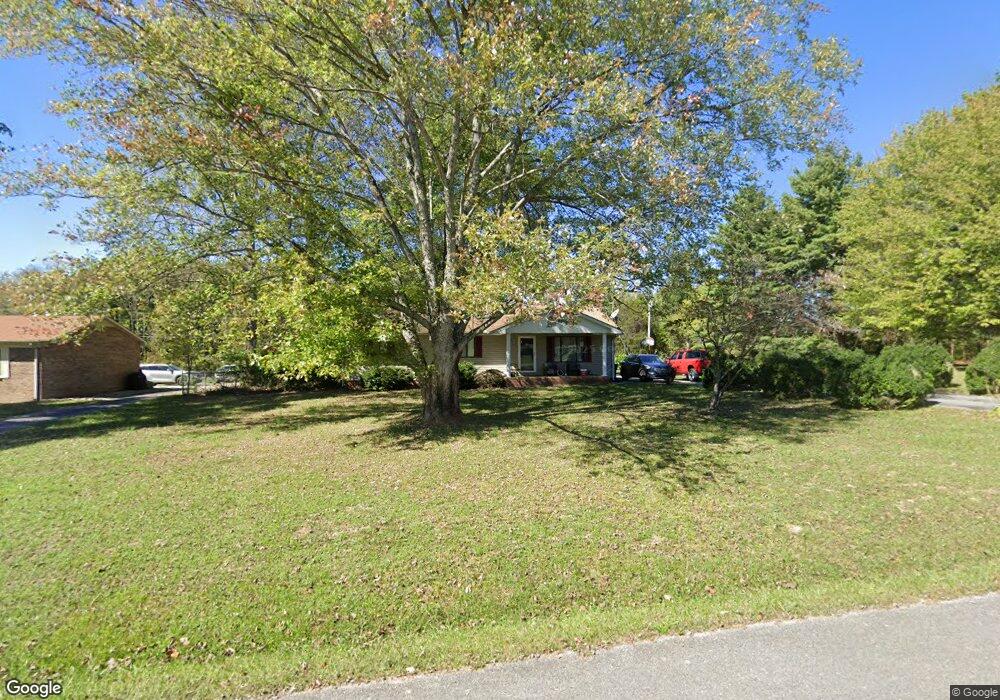
6756 Rader Ave Cookeville, TN 38506
Estimated Value: $283,000 - $342,000
3
Beds
2
Baths
2,100
Sq Ft
$144/Sq Ft
Est. Value
About This Home
This home is located at 6756 Rader Ave, Cookeville, TN 38506 and is currently estimated at $302,168, approximately $143 per square foot. 6756 Rader Ave is a home located in Putnam County with nearby schools including Cookeville High School, Algood Middle School, and Northeast Elementary School.
Ownership History
Date
Name
Owned For
Owner Type
Purchase Details
Closed on
Dec 11, 2020
Sold by
Crabtree Devin E and Crabtree Korrie A
Bought by
Crabtree Devin E and Crabtree Korrie A
Current Estimated Value
Home Financials for this Owner
Home Financials are based on the most recent Mortgage that was taken out on this home.
Original Mortgage
$134,000
Outstanding Balance
$125,954
Interest Rate
2.7%
Mortgage Type
New Conventional
Estimated Equity
$176,214
Purchase Details
Closed on
Oct 12, 2018
Sold by
Barnhart Ryan D
Bought by
Crabtree Devin E and West Korrie A
Home Financials for this Owner
Home Financials are based on the most recent Mortgage that was taken out on this home.
Original Mortgage
$133,333
Interest Rate
4.6%
Mortgage Type
New Conventional
Purchase Details
Closed on
Apr 6, 1979
Bought by
Miller Grover and Miller Geneva
Create a Home Valuation Report for This Property
The Home Valuation Report is an in-depth analysis detailing your home's value as well as a comparison with similar homes in the area
Home Values in the Area
Average Home Value in this Area
Purchase History
| Date | Buyer | Sale Price | Title Company |
|---|---|---|---|
| Crabtree Devin E | -- | Mortgage Information Svcs | |
| Crabtree Devin E | $132,000 | -- | |
| Miller Grover | -- | -- |
Source: Public Records
Mortgage History
| Date | Status | Borrower | Loan Amount |
|---|---|---|---|
| Open | Crabtree Devin E | $134,000 | |
| Closed | Crabtree Devin E | $133,333 |
Source: Public Records
Tax History Compared to Growth
Tax History
| Year | Tax Paid | Tax Assessment Tax Assessment Total Assessment is a certain percentage of the fair market value that is determined by local assessors to be the total taxable value of land and additions on the property. | Land | Improvement |
|---|---|---|---|---|
| 2024 | $1,134 | $42,625 | $4,000 | $38,625 |
| 2023 | $1,134 | $42,625 | $4,000 | $38,625 |
| 2022 | $1,054 | $42,625 | $4,000 | $38,625 |
| 2021 | $1,054 | $42,625 | $4,000 | $38,625 |
| 2020 | $774 | $42,625 | $4,000 | $38,625 |
| 2019 | $774 | $26,450 | $4,000 | $22,450 |
| 2018 | $722 | $26,450 | $4,000 | $22,450 |
| 2017 | $722 | $26,450 | $4,000 | $22,450 |
| 2016 | $722 | $26,450 | $4,000 | $22,450 |
| 2015 | $742 | $26,450 | $4,000 | $22,450 |
| 2014 | $718 | $25,590 | $0 | $0 |
Source: Public Records
Map
Nearby Homes