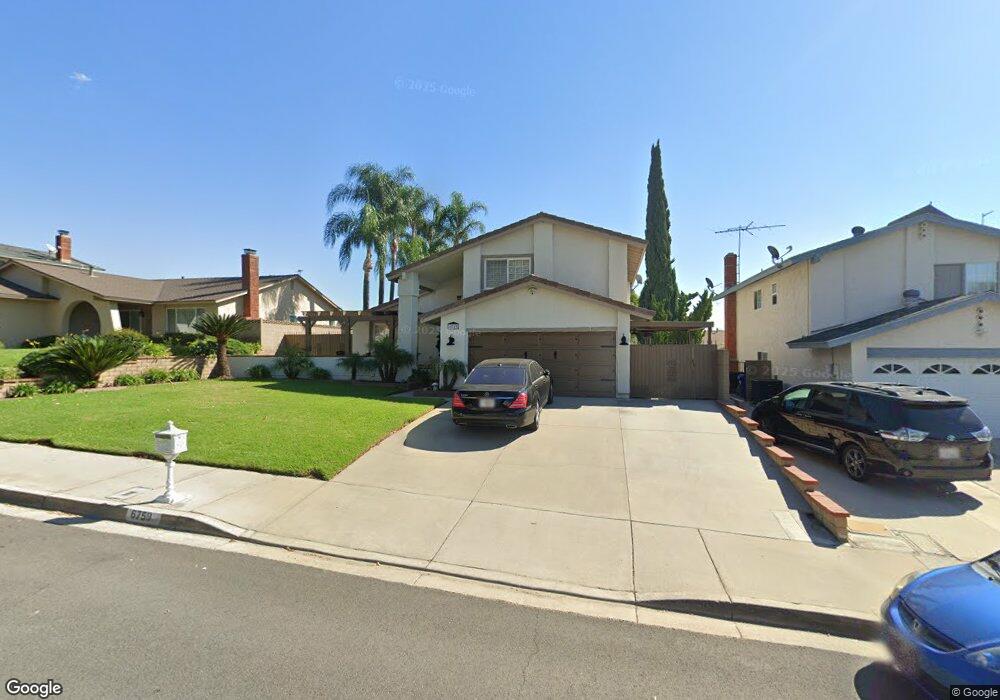
6759 Teak Way Rancho Cucamonga, CA 91701
Estimated Value: $827,304 - $1,003,000
4
Beds
3
Baths
2,012
Sq Ft
$450/Sq Ft
Est. Value
About This Home
This home is located at 6759 Teak Way, Rancho Cucamonga, CA 91701 and is currently estimated at $905,826, approximately $450 per square foot. 6759 Teak Way is a home located in San Bernardino County with nearby schools including Deer Canyon Elementary, Vineyard Junior High, and Los Osos High.
Ownership History
Date
Name
Owned For
Owner Type
Purchase Details
Closed on
Nov 2, 2021
Sold by
Tucci Joseph M and Tucci Charlotte
Bought by
Tucci Living Trust and Tucci
Current Estimated Value
Purchase Details
Closed on
Aug 5, 2002
Sold by
Tucci Richard
Bought by
Tucci Joseph M and Tucci Charlotte
Purchase Details
Closed on
Jun 24, 1994
Sold by
Tucci Richard
Bought by
Tucci Richard and Tucci Diane
Purchase Details
Closed on
May 18, 1994
Sold by
Minnis Earl
Bought by
Tucci Richard and Tucci Diane
Purchase Details
Closed on
Jan 17, 1994
Sold by
Turner Ron
Bought by
Minnis Earl and Tucci Richard
Purchase Details
Closed on
Dec 31, 1993
Sold by
G S L Financial
Bought by
Turner Ron and Turner Erin
Create a Home Valuation Report for This Property
The Home Valuation Report is an in-depth analysis detailing your home's value as well as a comparison with similar homes in the area
Home Values in the Area
Average Home Value in this Area
Purchase History
| Date | Buyer | Sale Price | Title Company |
|---|---|---|---|
| Tucci Living Trust | -- | Giammichele Steven | |
| Tucci Joseph M | $125,000 | Stewart Title | |
| Tucci Richard | -- | Orange Coast Title | |
| Tucci Richard | -- | Orange Coast Title Co | |
| Minnis Earl | $118,000 | Orange Coast Title Co | |
| Turner Ron | $112,700 | World Title Company |
Source: Public Records
Tax History Compared to Growth
Tax History
| Year | Tax Paid | Tax Assessment Tax Assessment Total Assessment is a certain percentage of the fair market value that is determined by local assessors to be the total taxable value of land and additions on the property. | Land | Improvement |
|---|---|---|---|---|
| 2025 | $4,155 | $389,603 | $108,626 | $280,977 |
| 2024 | $4,155 | $381,964 | $106,496 | $275,468 |
| 2023 | $4,061 | $374,475 | $104,408 | $270,067 |
| 2022 | $4,049 | $367,133 | $102,361 | $264,772 |
| 2021 | $4,046 | $359,934 | $100,354 | $259,580 |
| 2020 | $3,879 | $356,243 | $99,325 | $256,918 |
| 2019 | $3,922 | $349,257 | $97,377 | $251,880 |
| 2018 | $3,833 | $342,409 | $95,468 | $246,941 |
| 2017 | $3,657 | $335,695 | $93,596 | $242,099 |
| 2016 | $3,556 | $329,113 | $91,761 | $237,352 |
| 2015 | $3,533 | $324,170 | $90,383 | $233,787 |
| 2014 | $3,432 | $317,820 | $88,613 | $229,207 |
Source: Public Records
Map
Nearby Homes
- 10040 Jonquil Dr
- 6644 Brissac Place
- 6600 Montresor Place
- 6740 London Ave
- 10123 Finch Ave
- 9740 Woodleaf Dr
- 6949 Laguna Place Unit B1
- 7018 Princeton Place
- 6765 Jadeite Ave
- 6946 Archibald Ave
- 6880 Archibald Ave Unit 40
- 6880 Archibald Ave Unit 43
- 9757 Balaton St
- 9800 Baseline Rd Unit 71
- 9800 Baseline Rd Unit 17
- 9800 Baseline Rd Unit 82
- 9800 Baseline Rd Unit 62
- 10210 Baseline Rd Unit 30
- 10210 Baseline Rd Unit 62
- 10210 Baseline Rd Unit 115
- 6749 Teak Way
- 6769 Teak Way
- 6758 Cambridge Ave
- 6739 Teak Way
- 6748 Cambridge Ave
- 6758 Teak Way
- 6748 Teak Way
- 6738 Cambridge Ave
- 6770 Teak Way
- 6738 Teak Way
- 6729 Teak Way
- 10003 Mignonette St
- 10011 Mignonette St
- 6780 Teak Way
- 6728 Cambridge Ave
- 10021 Mignonette St
- 6728 Teak Way
- 6759 Cambridge Ave
- 6773 Berkshire Ave
- 6781 Berkshire Ave