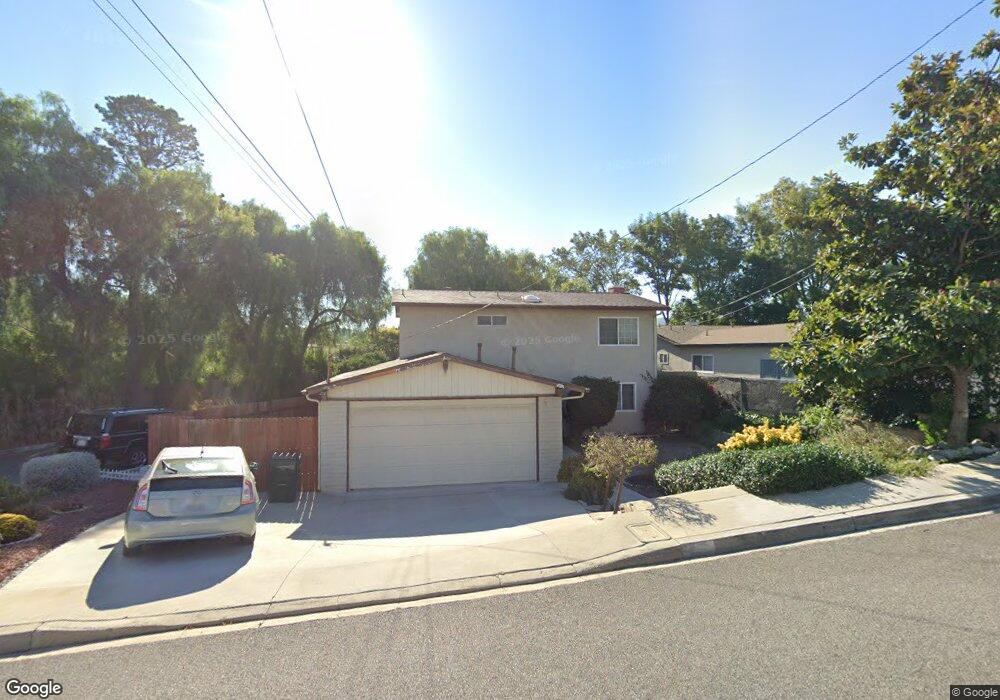
676 Benson Way Thousand Oaks, CA 91360
Estimated Value: $726,705 - $895,000
3
Beds
2
Baths
1,280
Sq Ft
$618/Sq Ft
Est. Value
About This Home
This home is located at 676 Benson Way, Thousand Oaks, CA 91360 and is currently estimated at $790,426, approximately $617 per square foot. 676 Benson Way is a home located in Ventura County with nearby schools including Glenwood Elementary School, Colina Middle School, and Westlake High School.
Ownership History
Date
Name
Owned For
Owner Type
Purchase Details
Closed on
Dec 4, 2015
Sold by
Peskin Chandra
Bought by
Peskin Chandra
Current Estimated Value
Home Financials for this Owner
Home Financials are based on the most recent Mortgage that was taken out on this home.
Original Mortgage
$310,000
Outstanding Balance
$245,565
Interest Rate
3.92%
Mortgage Type
New Conventional
Estimated Equity
$544,861
Purchase Details
Closed on
Mar 8, 2001
Sold by
Peskin Alexander
Bought by
Peskin Chandra
Home Financials for this Owner
Home Financials are based on the most recent Mortgage that was taken out on this home.
Original Mortgage
$166,000
Interest Rate
7.12%
Purchase Details
Closed on
Aug 3, 1995
Sold by
Transamerica Financial Services 0422
Bought by
Peskin Alexander and Peskin Chandra
Home Financials for this Owner
Home Financials are based on the most recent Mortgage that was taken out on this home.
Original Mortgage
$146,300
Interest Rate
7.63%
Create a Home Valuation Report for This Property
The Home Valuation Report is an in-depth analysis detailing your home's value as well as a comparison with similar homes in the area
Home Values in the Area
Average Home Value in this Area
Purchase History
| Date | Buyer | Sale Price | Title Company |
|---|---|---|---|
| Peskin Chandra | -- | Fidelity National Title Co | |
| Peskin Chandra | -- | Fidelity National Title Co | |
| Peskin Alexander | $154,072 | Continental Lawyers Title |
Source: Public Records
Mortgage History
| Date | Status | Borrower | Loan Amount |
|---|---|---|---|
| Open | Peskin Chandra | $310,000 | |
| Closed | Peskin Chandra | $166,000 | |
| Closed | Peskin Alexander | $146,300 |
Source: Public Records
Tax History Compared to Growth
Tax History
| Year | Tax Paid | Tax Assessment Tax Assessment Total Assessment is a certain percentage of the fair market value that is determined by local assessors to be the total taxable value of land and additions on the property. | Land | Improvement |
|---|---|---|---|---|
| 2025 | $3,065 | $255,778 | $166,096 | $89,682 |
| 2024 | $3,065 | $250,763 | $162,839 | $87,924 |
| 2023 | $2,956 | $245,847 | $159,647 | $86,200 |
| 2022 | $2,900 | $241,027 | $156,517 | $84,510 |
| 2021 | $2,847 | $236,301 | $153,448 | $82,853 |
| 2020 | $2,455 | $233,880 | $151,876 | $82,004 |
| 2019 | $2,390 | $229,296 | $148,899 | $80,397 |
| 2018 | $2,341 | $224,801 | $145,980 | $78,821 |
| 2017 | $2,294 | $220,394 | $143,118 | $77,276 |
| 2016 | $2,272 | $216,073 | $140,312 | $75,761 |
| 2015 | $2,231 | $212,829 | $138,205 | $74,624 |
| 2014 | $2,199 | $208,662 | $135,499 | $73,163 |
Source: Public Records
Map
Nearby Homes
- 647 Brossard Dr
- 245 Houston Dr
- 163 Houston Dr
- 978 Bower Way
- 331 Dryden St
- 1000 E Thousand Oaks Blvd
- 1116 Rexford Place
- 1248 La Peresa Dr
- 566 Rancho Rd
- 910 Warwick Ave
- 1340 E Hillcrest Dr Unit 8
- 1342 E Hillcrest Dr Unit 20
- 1305 Sheffield Place
- 918 Rancho Rd
- 932 Rosario Dr
- 1649 Hauser Cir
- 110 Maegan Place Unit 13
- 68 Maegan Place Unit 7
- 37 Wales St
- 62 Maegan Place Unit 4
- 674 Benson Way
- 694 Benson Way
- 670 Benson Way
- 543 Dallas Dr
- 662 Benson Way
- 698 Benson Way
- 687 Masterson Dr
- 677 Benson Way
- 679 Benson Way
- 669 Benson Way
- 681 Benson Way
- 646 Benson Way
- 702 Benson Way
- 699 Masterson Dr
- 531 Dallas Dr
- 685 Benson Way
- 667 Benson Way
- 689 Benson Way
- 657 Benson Way
- 632 Benson Way