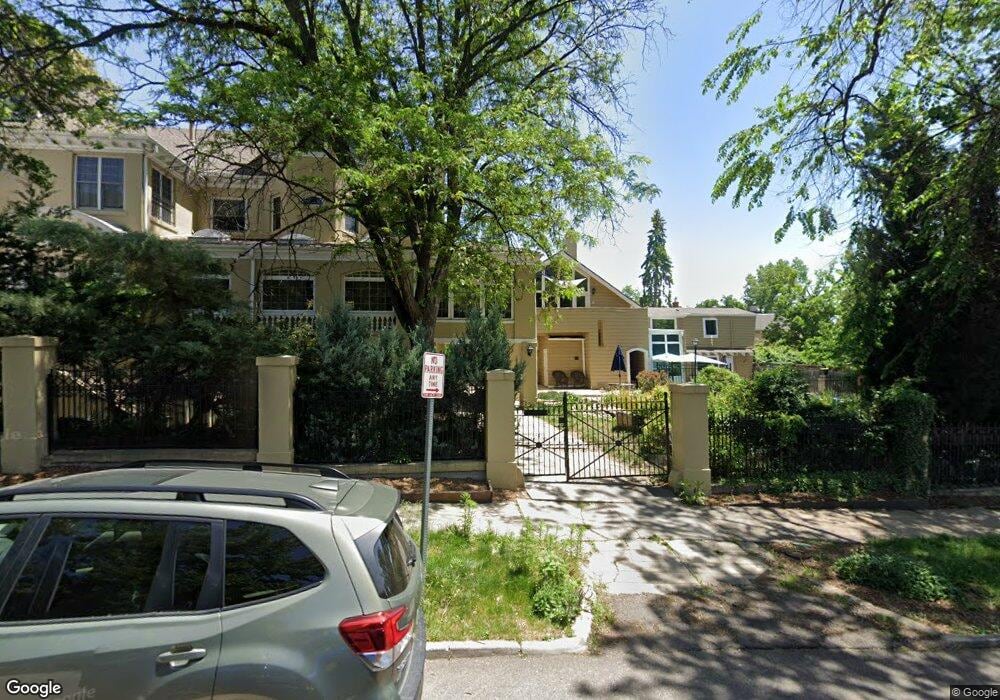
676 Clarkson St Unit 676 Denver, CO 80218
Alamo Placita NeighborhoodEstimated Value: $527,000 - $713,000
2
Beds
3
Baths
1,656
Sq Ft
$361/Sq Ft
Est. Value
About This Home
This home is located at 676 Clarkson St Unit 676, Denver, CO 80218 and is currently estimated at $598,031, approximately $361 per square foot. 676 Clarkson St Unit 676 is a home located in Denver County with nearby schools including Dora Moore ECE-8 School, Morey Middle School, and East High School.
Ownership History
Date
Name
Owned For
Owner Type
Purchase Details
Closed on
Jan 5, 2022
Sold by
West End Realty Llc
Bought by
Mccabe Colleen
Current Estimated Value
Home Financials for this Owner
Home Financials are based on the most recent Mortgage that was taken out on this home.
Original Mortgage
$505,000
Outstanding Balance
$465,481
Interest Rate
3.12%
Mortgage Type
New Conventional
Estimated Equity
$132,550
Purchase Details
Closed on
Dec 16, 2014
Sold by
Cantor Ethan J
Bought by
West End Realty Llc
Purchase Details
Closed on
Jul 29, 2004
Sold by
Clarkson Mansion Condo Developer Lllc
Bought by
Cantor Ethan J
Home Financials for this Owner
Home Financials are based on the most recent Mortgage that was taken out on this home.
Original Mortgage
$284,000
Interest Rate
3.73%
Mortgage Type
Purchase Money Mortgage
Create a Home Valuation Report for This Property
The Home Valuation Report is an in-depth analysis detailing your home's value as well as a comparison with similar homes in the area
Home Values in the Area
Average Home Value in this Area
Purchase History
| Date | Buyer | Sale Price | Title Company |
|---|---|---|---|
| Mccabe Colleen | $540,000 | None Listed On Document | |
| West End Realty Llc | $353,100 | Land Title Guarantee Company | |
| Cantor Ethan J | $355,000 | Title America |
Source: Public Records
Mortgage History
| Date | Status | Borrower | Loan Amount |
|---|---|---|---|
| Open | Mccabe Colleen | $505,000 | |
| Previous Owner | Cantor Ethan J | $284,000 |
Source: Public Records
Tax History Compared to Growth
Tax History
| Year | Tax Paid | Tax Assessment Tax Assessment Total Assessment is a certain percentage of the fair market value that is determined by local assessors to be the total taxable value of land and additions on the property. | Land | Improvement |
|---|---|---|---|---|
| 2024 | $2,947 | $37,210 | $1,630 | $35,580 |
| 2023 | $2,883 | $37,210 | $1,630 | $35,580 |
| 2022 | $2,778 | $34,930 | $5,520 | $29,410 |
| 2021 | $2,681 | $35,930 | $5,680 | $30,250 |
| 2020 | $1,982 | $26,710 | $5,680 | $21,030 |
| 2019 | $1,926 | $26,710 | $5,680 | $21,030 |
| 2018 | $2,244 | $29,010 | $5,720 | $23,290 |
| 2017 | $2,238 | $29,010 | $5,720 | $23,290 |
| 2016 | $2,639 | $32,360 | $4,744 | $27,616 |
| 2015 | $2,528 | $32,360 | $4,744 | $27,616 |
| 2014 | $1,814 | $21,840 | $4,824 | $17,016 |
Source: Public Records
Map
Nearby Homes
- 680 N Clarkson St
- 685 N Emerson St
- 700 N Washington St Unit 201
- 700 N Washington St Unit 402
- 700 N Washington St Unit 502
- 680 Emerson St
- 636 N Washington St Unit 102
- 636 N Washington St Unit 301
- 790 N Clarkson St Unit 204
- 790 N Clarkson St Unit 206
- 789 N Clarkson St Unit 406
- 707 N Washington St Unit B
- 611 E 7th Ave Unit 108
- 665 Washington St Unit 5B
- 620 Emerson St
- 790 N Washington St Unit 206
- 790 N Washington St Unit 305
- 790 N Washington St Unit 1105
- 790 N Washington St Unit 1004
- 777 N Washington St Unit 508
- 678 Clarkson St Unit 678
- 674 Clarkson St Unit 674
- 672 Clarkson St Unit 672
- 672 N Clarkson St
- 680 Clarkson St Unit 680
- 682 Clarkson St Unit 682
- 670 Clarkson St Unit 670
- 682 N Clarkson St
- 805 E 7th Ave
- 668 N Clarkson St
- 668 Clarkson St
- 685 Clarkson St
- 794 E 7th Ave
- 646 Clarkson St Unit 648
- 685 Emerson St
- 685 N Emerson St Unit A
- 774 E 7th Ave
- 805 E 7th Ave
- 805 E 7th Ave
- 805 E 7th Ave