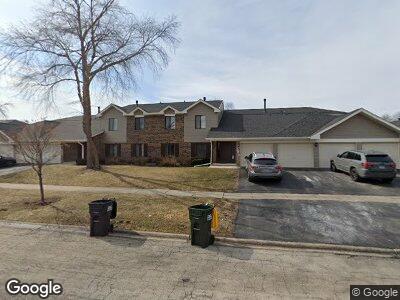
676 Cumberland Trail Unit 22B1 Roselle, IL 60172
South Schaumburg NeighborhoodEstimated Value: $234,109 - $280,000
2
Beds
1
Bath
1,100
Sq Ft
$232/Sq Ft
Est. Value
About This Home
This home is located at 676 Cumberland Trail Unit 22B1, Roselle, IL 60172 and is currently estimated at $255,027, approximately $231 per square foot. 676 Cumberland Trail Unit 22B1 is a home located in Cook County with nearby schools including Frederick Nerge Elementary School, Margaret Mead Junior High School, and J B Conant High School.
Ownership History
Date
Name
Owned For
Owner Type
Purchase Details
Closed on
Apr 13, 2021
Sold by
Kalmaitis Darius and Kalnaitis Sonata
Bought by
Kalnaitis Sonata and Kalnaitis Darius
Current Estimated Value
Purchase Details
Closed on
Jan 10, 2020
Sold by
Kalnaitis Darius
Bought by
Kalanitis Darius and Kalnaitis Sonata
Purchase Details
Closed on
May 28, 2004
Sold by
Bonacci Santina and Stutler Joann
Bought by
Kalnaitis Darius
Home Financials for this Owner
Home Financials are based on the most recent Mortgage that was taken out on this home.
Original Mortgage
$149,380
Interest Rate
6.46%
Mortgage Type
Unknown
Purchase Details
Closed on
Aug 18, 1995
Sold by
Suffredin John and Suffredin Gail
Bought by
Bonacci Santina and Stutler Joann
Create a Home Valuation Report for This Property
The Home Valuation Report is an in-depth analysis detailing your home's value as well as a comparison with similar homes in the area
Home Values in the Area
Average Home Value in this Area
Purchase History
| Date | Buyer | Sale Price | Title Company |
|---|---|---|---|
| Kalnaitis Sonata | -- | Attorney | |
| Kalanitis Darius | -- | Attorney | |
| Kalnaitis Darius | $154,000 | Pntn | |
| Bonacci Santina | $96,000 | Lawyers Title Insurance Corp |
Source: Public Records
Mortgage History
| Date | Status | Borrower | Loan Amount |
|---|---|---|---|
| Open | Kalnaitis Darius | $146,980 | |
| Closed | Kalnaitis Darius | $147,400 | |
| Closed | Kalnaitis Darius | $147,900 | |
| Closed | Kalnaitis Darius | $27,800 | |
| Closed | Kalnaitis Darius | $148,300 | |
| Closed | Kalnaitis Darius | $149,380 |
Source: Public Records
Tax History Compared to Growth
Tax History
| Year | Tax Paid | Tax Assessment Tax Assessment Total Assessment is a certain percentage of the fair market value that is determined by local assessors to be the total taxable value of land and additions on the property. | Land | Improvement |
|---|---|---|---|---|
| 2024 | $3,687 | $16,571 | $1,094 | $15,477 |
| 2023 | $3,687 | $16,571 | $1,094 | $15,477 |
| 2022 | $3,687 | $16,571 | $1,094 | $15,477 |
| 2021 | $3,064 | $13,049 | $937 | $12,112 |
| 2020 | $3,088 | $13,049 | $937 | $12,112 |
| 2019 | $3,127 | $14,673 | $937 | $13,736 |
| 2018 | $2,227 | $10,655 | $781 | $9,874 |
| 2017 | $2,204 | $10,655 | $781 | $9,874 |
| 2016 | $2,313 | $10,655 | $781 | $9,874 |
| 2015 | $2,301 | $10,072 | $687 | $9,385 |
| 2014 | $2,268 | $10,072 | $687 | $9,385 |
| 2013 | $2,181 | $10,072 | $687 | $9,385 |
Source: Public Records
Map
Nearby Homes
- 531 Cumberland Trail Unit A
- 791 Overland Ct Unit 3
- 1813 Longboat Dr
- 609 Bryce Trail
- 35 Plum Grove Rd
- 734 Bluejay Cir
- 609 White Sands Bay
- 610 E Woodfield Trail
- 1223 Knottingham Ct Unit 2A
- 658 Cutter Ln
- 640 Cutter Ln
- 675 Circle Dr Unit 2
- 830 Knottingham Dr Unit 2B
- 920 Surrey Dr Unit 1A
- 1482 Armstrong Ct
- 1474 Haar Ln
- 701 Forum Dr Unit 310
- 513 N Woodfield Trail
- 554 N Woodfield Trail
- 1416 Hodlmair Ln
- 676 Cumberland Trail Unit 22B2
- 676 Cumberland Trail Unit 22B1
- 676 Cumberland Trail Unit 22A1
- 676 Cumberland Trail Unit 22A2
- 676 Cumberland Trail Unit B1
- 676 Cumberland Trail Unit B2
- 676 Cumberland Trail Unit A-1
- 660 Cumberland Trail Unit 22BB
- 660 Cumberland Trail Unit 22AA
- 660 Cumberland Trail Unit 22B1
- 660 Cumberland Trail Unit 22AA
- 660 Cumberland Trail Unit BB2
- 660 Cumberland Trail Unit BB1
- 660 Cumberland Trail Unit AA2
- 646 Cumberland Trail Unit 24B2
- 646 Cumberland Trail Unit 24A1
- 646 Cumberland Trail Unit 24A2
- 646 Cumberland Trail Unit 24B1
- 646 Cumberland Trail Unit B-1
- 646 Cumberland Trail Unit B-2