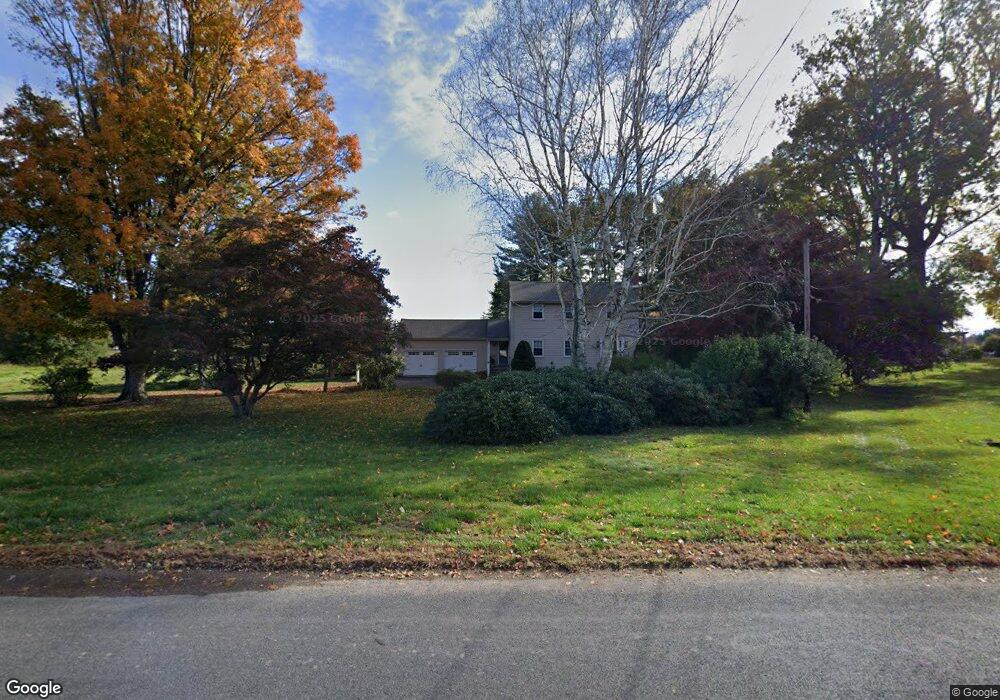
676 Main St South Windsor, CT 06074
Estimated Value: $423,000 - $462,298
3
Beds
2
Baths
1,830
Sq Ft
$243/Sq Ft
Est. Value
About This Home
This home is located at 676 Main St, South Windsor, CT 06074 and is currently estimated at $444,325, approximately $242 per square foot. 676 Main St is a home located in Hartford County with nearby schools including Timothy Edwards School and South Windsor High School.
Ownership History
Date
Name
Owned For
Owner Type
Purchase Details
Closed on
Apr 13, 2010
Sold by
Simonds Michael and Simonds Nancy
Bought by
Miller Peter and Miller Josephine
Current Estimated Value
Home Financials for this Owner
Home Financials are based on the most recent Mortgage that was taken out on this home.
Original Mortgage
$220,000
Outstanding Balance
$140,000
Interest Rate
4.12%
Estimated Equity
$304,325
Purchase Details
Closed on
May 31, 1994
Sold by
Macdonald Margaret P
Bought by
Simonds Michael and Simonds Nancy
Create a Home Valuation Report for This Property
The Home Valuation Report is an in-depth analysis detailing your home's value as well as a comparison with similar homes in the area
Home Values in the Area
Average Home Value in this Area
Purchase History
| Date | Buyer | Sale Price | Title Company |
|---|---|---|---|
| Miller Peter | $275,000 | -- | |
| Simonds Michael | $175,500 | -- |
Source: Public Records
Mortgage History
| Date | Status | Borrower | Loan Amount |
|---|---|---|---|
| Open | Simonds Michael | $220,000 | |
| Previous Owner | Simonds Michael | $40,000 | |
| Previous Owner | Simonds Michael | $110,000 | |
| Previous Owner | Simonds Michael | $103,200 |
Source: Public Records
Tax History Compared to Growth
Tax History
| Year | Tax Paid | Tax Assessment Tax Assessment Total Assessment is a certain percentage of the fair market value that is determined by local assessors to be the total taxable value of land and additions on the property. | Land | Improvement |
|---|---|---|---|---|
| 2024 | $8,394 | $243,600 | $102,700 | $140,900 |
| 2023 | $8,073 | $243,600 | $102,700 | $140,900 |
| 2022 | $7,118 | $183,600 | $98,400 | $85,200 |
| 2021 | $6,951 | $183,600 | $98,400 | $85,200 |
| 2020 | $6,955 | $183,600 | $98,400 | $85,200 |
| 2019 | $7,069 | $183,600 | $98,400 | $85,200 |
| 2018 | $6,916 | $183,600 | $98,400 | $85,200 |
| 2017 | $6,790 | $178,300 | $98,400 | $79,900 |
| 2016 | $6,658 | $178,300 | $98,400 | $79,900 |
| 2015 | $6,515 | $178,300 | $98,400 | $79,900 |
| 2014 | $6,331 | $178,300 | $98,400 | $79,900 |
Source: Public Records
Map
Nearby Homes
- 749 Main St
- 51 Pleasant Valley Rd
- 951 Main St
- 1063 Main St
- 438 Pleasant Valley Rd
- 220 Pepin Place Unit 220
- 1 Saint Marc Cir Unit A
- 5 Saint Marc Cir Unit H
- 11 Saint Marc Cir O Cir
- 75 Sharon Dr
- 50 Parkview Dr
- 119 Joshua Hill
- 101 Seymour St
- 69 Pheasant Ln
- 9 Main St Unit TRLR 22
- 140 Portman St
- 157 Henry St
- 220 Deerfield Rd
- 12 Depauw Cir
- 58 Amanda Cir