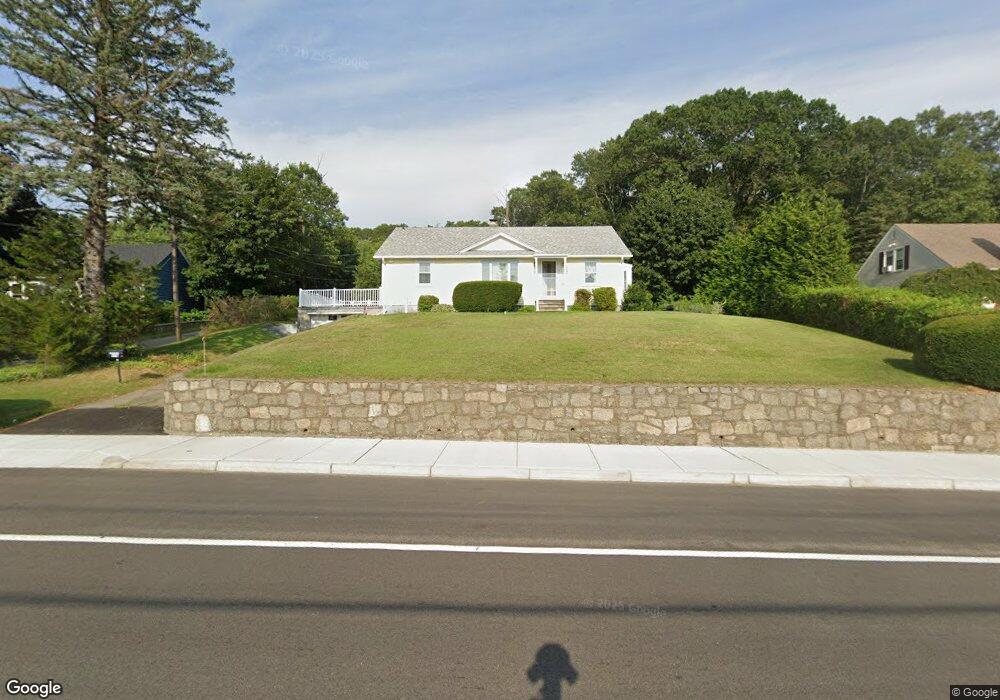
676 Mendon Rd Woonsocket, RI 02895
East Woonsocket NeighborhoodEstimated Value: $401,000 - $456,000
3
Beds
1
Bath
1,725
Sq Ft
$248/Sq Ft
Est. Value
About This Home
This home is located at 676 Mendon Rd, Woonsocket, RI 02895 and is currently estimated at $427,240, approximately $247 per square foot. 676 Mendon Rd is a home located in Providence County with nearby schools including Woonsocket High School and Good Shepherd Catholic School.
Ownership History
Date
Name
Owned For
Owner Type
Purchase Details
Closed on
Sep 10, 2014
Sold by
Forte Tr Richard J
Bought by
Forte Richard J
Current Estimated Value
Home Financials for this Owner
Home Financials are based on the most recent Mortgage that was taken out on this home.
Original Mortgage
$225,000
Outstanding Balance
$171,754
Interest Rate
4.14%
Estimated Equity
$255,486
Create a Home Valuation Report for This Property
The Home Valuation Report is an in-depth analysis detailing your home's value as well as a comparison with similar homes in the area
Home Values in the Area
Average Home Value in this Area
Purchase History
| Date | Buyer | Sale Price | Title Company |
|---|---|---|---|
| Forte Richard J | -- | -- | |
| Forte Richard J | -- | -- |
Source: Public Records
Mortgage History
| Date | Status | Borrower | Loan Amount |
|---|---|---|---|
| Open | Forte Richard J | $225,000 |
Source: Public Records
Tax History
| Year | Tax Paid | Tax Assessment Tax Assessment Total Assessment is a certain percentage of the fair market value that is determined by local assessors to be the total taxable value of land and additions on the property. | Land | Improvement |
|---|---|---|---|---|
| 2025 | $4,631 | $412,400 | $112,100 | $300,300 |
| 2024 | $4,115 | $283,000 | $99,500 | $183,500 |
| 2023 | $3,956 | $283,000 | $99,500 | $183,500 |
| 2022 | $3,956 | $283,000 | $99,500 | $183,500 |
| 2021 | $3,769 | $158,700 | $65,900 | $92,800 |
| 2020 | $3,809 | $158,700 | $65,900 | $92,800 |
| 2018 | $3,821 | $158,700 | $65,900 | $92,800 |
| 2017 | $3,988 | $132,500 | $48,900 | $83,600 |
| 2016 | $4,219 | $132,500 | $48,900 | $83,600 |
| 2015 | $4,847 | $132,500 | $48,900 | $83,600 |
| 2014 | $4,723 | $131,400 | $53,700 | $77,700 |
Source: Public Records
Map
Nearby Homes
- 727 Mendon Rd
- 95 Mitris Blvd
- 255 Knollwood Dr
- 68 Kenwood St
- 7 Theresa Marie Ave
- 202 Paine St
- 1088 Diamond Hill Rd
- 89 Saint Agnes Ave
- 194 Paine St
- 212 Saint Louis Ave
- 188 Saint Louis Ave
- 178 Saint Louis Ave
- 375 Congress St
- 568 Elm St
- 34 Heroux Ave
- 179 Dawn Blvd
- 372 Cumberland Hill Rd
- 56 Mailloux St
- 551 Wood Ave
- 311 Elm St
- 646 Mendon Rd
- 692 Mendon Rd
- 674R Mendon Rd
- 675 Mendon Rd
- 651 Mendon Rd
- 665 Mendon Rd
- 665 Mendon Rd Unit SI FL2-ID1347759P
- 665 Mendon Rd Unit FL2-ID1347759P
- 632 Mendon Rd
- 689 Mendon Rd
- 195 Papineau Ave
- 221 Papineau Ave
- 705 Mendon Rd
- 629 Mendon Rd
- 736 Mendon Rd
- 715 Mendon Rd
- 608 Mendon Rd
- 615 Mendon Rd
- 147 Papineau Ave
- 737 Mendon Rd
Your Personal Tour Guide
Ask me questions while you tour the home.