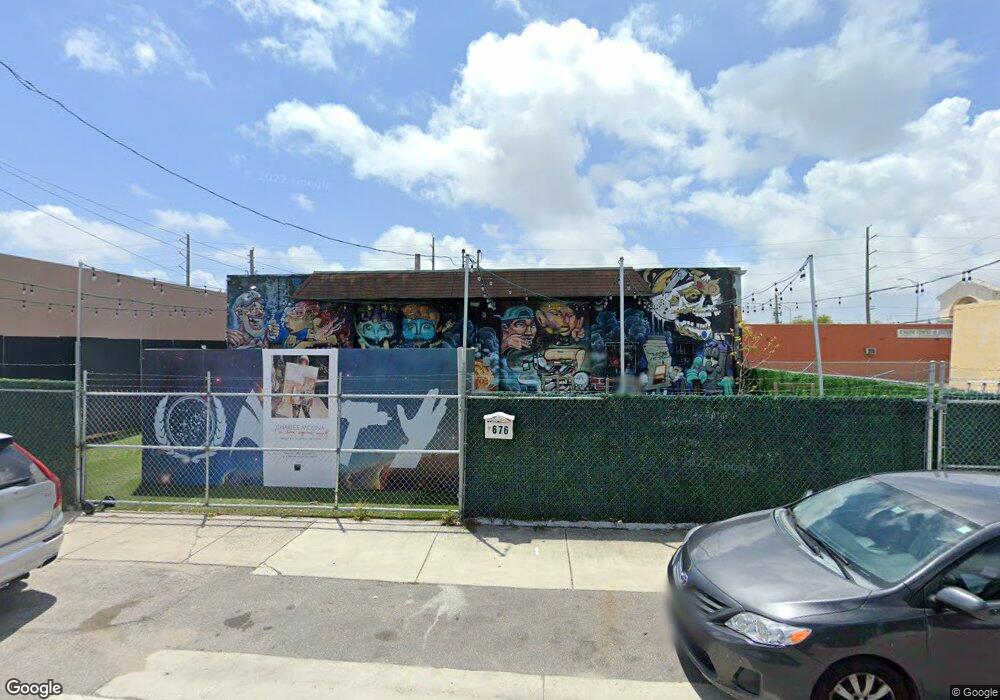
676 NW 23rd St Miami, FL 33127
Allapattah NeighborhoodEstimated Value: $642,386
--
Bed
--
Bath
2,924
Sq Ft
$220/Sq Ft
Est. Value
About This Home
This home is located at 676 NW 23rd St, Miami, FL 33127 and is currently estimated at $642,386, approximately $219 per square foot. 676 NW 23rd St is a home located in Miami-Dade County with nearby schools including Paul Laurence Dunbar K-8 Center, Georgia Jones Ayers Middle School, and Miami Jackson Senior High School.
Ownership History
Date
Name
Owned For
Owner Type
Purchase Details
Closed on
Dec 14, 2015
Sold by
Family Consolidated Trust Llc
Bought by
Artquimia International Llc
Current Estimated Value
Purchase Details
Closed on
Dec 9, 2014
Sold by
Artquimia International Llc
Bought by
Family Consolidated Trust Llc
Purchase Details
Closed on
Jul 1, 2012
Sold by
Delucia Rosario and De Lucia Miriam
Bought by
Artquimia International Llc
Purchase Details
Closed on
Feb 27, 2008
Sold by
Chems Art D & D Llc
Bought by
Delucia Rosario and Delucia Miriam
Purchase Details
Closed on
Apr 28, 2006
Sold by
Cameco Enterprises Inc
Bought by
Chems Art D & D Llc
Purchase Details
Closed on
Jan 13, 2005
Sold by
Herrera Homero and Herrera Dolores
Bought by
Herrera Family Ltd
Purchase Details
Closed on
Apr 9, 2003
Sold by
Herrera Homero and Herrera Dolores
Bought by
Herrera Family Ltd Partnership
Create a Home Valuation Report for This Property
The Home Valuation Report is an in-depth analysis detailing your home's value as well as a comparison with similar homes in the area
Home Values in the Area
Average Home Value in this Area
Purchase History
| Date | Buyer | Sale Price | Title Company |
|---|---|---|---|
| Artquimia International Llc | -- | Attorney | |
| Family Consolidated Trust Llc | -- | Attorney | |
| Artquimia International Llc | -- | None Available | |
| Delucia Rosario | -- | None Available | |
| Chems Art D & D Llc | $370,000 | Attorney | |
| Herrera Family Ltd | -- | -- | |
| Cameco Enterprises Inc | $195,000 | -- | |
| Herrera Family Ltd Partnership | -- | -- |
Source: Public Records
Tax History Compared to Growth
Tax History
| Year | Tax Paid | Tax Assessment Tax Assessment Total Assessment is a certain percentage of the fair market value that is determined by local assessors to be the total taxable value of land and additions on the property. | Land | Improvement |
|---|---|---|---|---|
| 2025 | $9,640 | $440,746 | -- | -- |
| 2024 | $8,672 | $400,679 | -- | -- |
| 2023 | $8,672 | $364,254 | $0 | $0 |
| 2022 | $7,761 | $331,140 | $0 | $0 |
| 2021 | $6,396 | $301,037 | $210,600 | $90,437 |
| 2020 | $6,100 | $302,479 | $210,600 | $91,879 |
| 2019 | $5,736 | $299,942 | $210,600 | $89,342 |
| 2018 | $0 | $371,521 | $280,800 | $90,721 |
| 2017 | $4,430 | $209,099 | $0 | $0 |
| 2016 | $4,503 | $206,309 | $0 | $0 |
| 2015 | $3,932 | $178,943 | $0 | $0 |
| 2014 | $3,932 | $144,471 | $0 | $0 |
Source: Public Records
Map
Nearby Homes
- 2410 NW 7th Ct
- 2025 NW 6th Place
- 176 NW 28th St
- 1999 NW 5th Place
- 660,662,664 NW 29th St
- 1968 NW 4th Ct Unit 323
- 1990 NW 4th Ct Unit 8
- 410 NW 20th St Unit 5
- 430 NW 20th St
- 584 NW 30th St
- 683 & 681 & 679 NW 30th St
- 550 NW 30th St
- 683 NW 30th St
- 681 NW 30th St
- 679 NW 30th St
- 483 NW 19th St Unit 362
- 1101 NW 25th St
- 652 NW 31st St
- 737 NW 30th St
- 2900 NW 10th Ave
- 670 NW 23rd St
- 2299 NW 7th Ave
- 666 NW 23rd St
- 654 NW 23rd St
- 669 NW 22nd St
- 2209 NW 7th Ave
- 663 NW 22nd St
- 0 NW 22nd St Unit A1651014
- 639 NW 22nd St
- 2300 NW 7th Ave
- 714 NW 22nd St
- 711 NW 23rd St
- 726 NW 24th St Unit front
- 726 NW 24th St Unit front unit
- 726 NW 24th St
- 726 NW 24th St Unit 1
- 2324 NW 7th Ct
- 2177 NW 6th Place
- 2320 NW 7th Ct
- 2320 NW 7th Ct Unit 2322