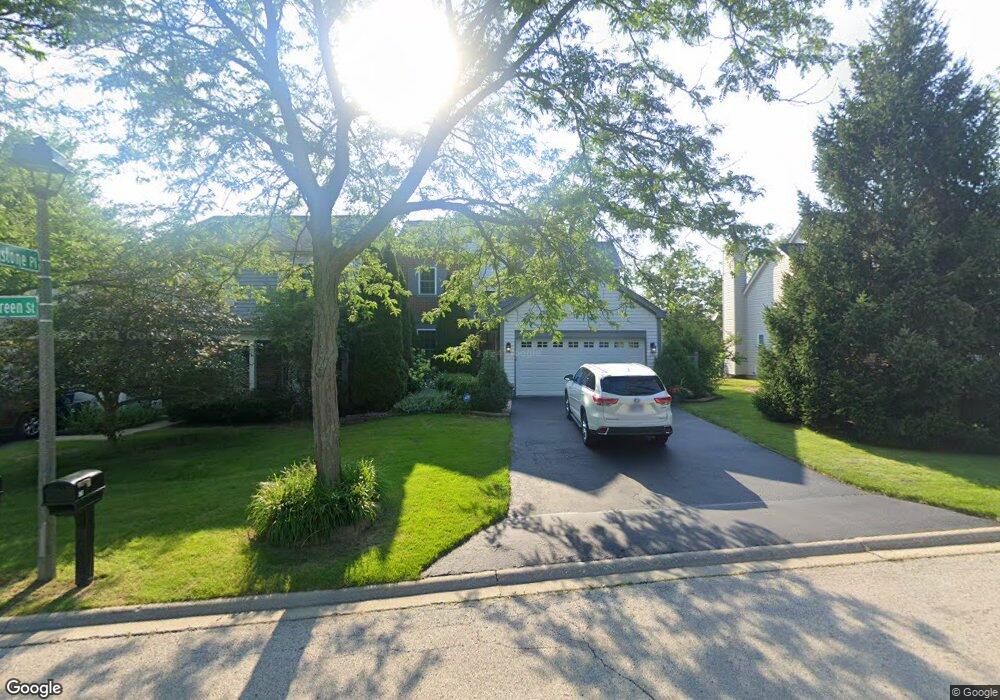
676 Rolling Green St Gurnee, IL 60031
Estimated Value: $348,000 - $412,000
3
Beds
3
Baths
1,696
Sq Ft
$225/Sq Ft
Est. Value
About This Home
This home is located at 676 Rolling Green St, Gurnee, IL 60031 and is currently estimated at $381,606, approximately $225 per square foot. 676 Rolling Green St is a home located in Lake County with nearby schools including Woodland Primary School, Woodland Elementary School, and Woodland Intermediate School.
Ownership History
Date
Name
Owned For
Owner Type
Purchase Details
Closed on
Mar 11, 2016
Sold by
Smith Maryalice
Bought by
Maryalice Smith Revocable Living Trust
Current Estimated Value
Purchase Details
Closed on
Mar 12, 2007
Sold by
Yarc Patricia J
Bought by
Smith Maryalice
Home Financials for this Owner
Home Financials are based on the most recent Mortgage that was taken out on this home.
Original Mortgage
$200,000
Outstanding Balance
$121,982
Interest Rate
6.4%
Mortgage Type
Purchase Money Mortgage
Estimated Equity
$259,624
Purchase Details
Closed on
Dec 15, 1994
Sold by
Grzadzielewski Stella A
Bought by
Yarc Patricia J
Purchase Details
Closed on
May 16, 1994
Sold by
Northern Trust Bk Lake Forest Natl Assn
Bought by
Grzadzielewski Stella
Home Financials for this Owner
Home Financials are based on the most recent Mortgage that was taken out on this home.
Original Mortgage
$50,000
Interest Rate
8.41%
Create a Home Valuation Report for This Property
The Home Valuation Report is an in-depth analysis detailing your home's value as well as a comparison with similar homes in the area
Home Values in the Area
Average Home Value in this Area
Purchase History
| Date | Buyer | Sale Price | Title Company |
|---|---|---|---|
| Maryalice Smith Revocable Living Trust | -- | Attorney | |
| Smith Maryalice | $251,500 | Ticor | |
| Yarc Patricia J | -- | -- | |
| Grzadzielewski Stella | $185,000 | Chicago Title Insurance Co |
Source: Public Records
Mortgage History
| Date | Status | Borrower | Loan Amount |
|---|---|---|---|
| Open | Smith Maryalice | $200,000 | |
| Previous Owner | Grzadzielewski Stella | $50,000 |
Source: Public Records
Tax History Compared to Growth
Tax History
| Year | Tax Paid | Tax Assessment Tax Assessment Total Assessment is a certain percentage of the fair market value that is determined by local assessors to be the total taxable value of land and additions on the property. | Land | Improvement |
|---|---|---|---|---|
| 2024 | $7,961 | $111,908 | $15,691 | $96,217 |
| 2023 | $7,783 | $97,010 | $13,602 | $83,408 |
| 2022 | $7,783 | $90,851 | $13,606 | $77,245 |
| 2021 | $7,011 | $87,206 | $13,060 | $74,146 |
| 2020 | $6,769 | $85,062 | $12,739 | $72,323 |
| 2019 | $6,567 | $82,592 | $12,369 | $70,223 |
| 2018 | $5,677 | $79,002 | $15,245 | $63,757 |
| 2017 | $6,068 | $76,738 | $14,808 | $61,930 |
| 2016 | $6,471 | $73,322 | $14,149 | $59,173 |
| 2015 | $6,294 | $69,539 | $13,419 | $56,120 |
| 2014 | $6,528 | $70,430 | $13,254 | $57,176 |
| 2012 | $6,174 | $70,969 | $13,355 | $57,614 |
Source: Public Records
Map
Nearby Homes
- 6121 Brookstone Place
- 6296 Doral Dr
- 690 Chandler Rd Unit 102
- 690 Chandler Rd Unit 207
- 690 Chandler Rd Unit 305
- 650 Whitney Ct Unit 203
- 6141 Crossland Blvd
- 776 Chandler Rd
- 6359 Doral Dr
- 6161 Oakmont Ln
- 6191 Oakmont Ln
- 741 Colby Ct Unit U42
- 917 Vose Dr Unit 304
- 920 Vose Dr Unit 304
- 920 Vose Dr Unit 106
- 920 Vose Dr Unit 105
- 914 Vose Dr
- 651 White Ct
- 6402 Barn Swallow Ct
- 638 Dordan Ct
- 670 Rolling Green St
- 682 Rolling Green St
- 664 Rolling Green St
- 688 Rolling Green St
- 6190 Brookstone Place
- 694 Rolling Green St
- 658 Rolling Green St
- 669 Sandwedge Place
- 663 Sandwedge Place
- 657 Sandwedge Place
- 6182 Brookstone Place
- 6181 Brookstone Place
- 6175 Golfview Dr
- 700 Rolling Green St
- 6300 Eagle Ridge Dr
- 651 Sandwedge Place
- 6171 Golfview Dr
- 6170 Brookstone Place
- 645 Sandwedge Place
- 6173 Brookstone Place