676 Stag Dr Unit 69POD Warsaw, IN 46582
Estimated Value: $247,000 - $262,000
3
Beds
2
Baths
1,200
Sq Ft
$214/Sq Ft
Est. Value
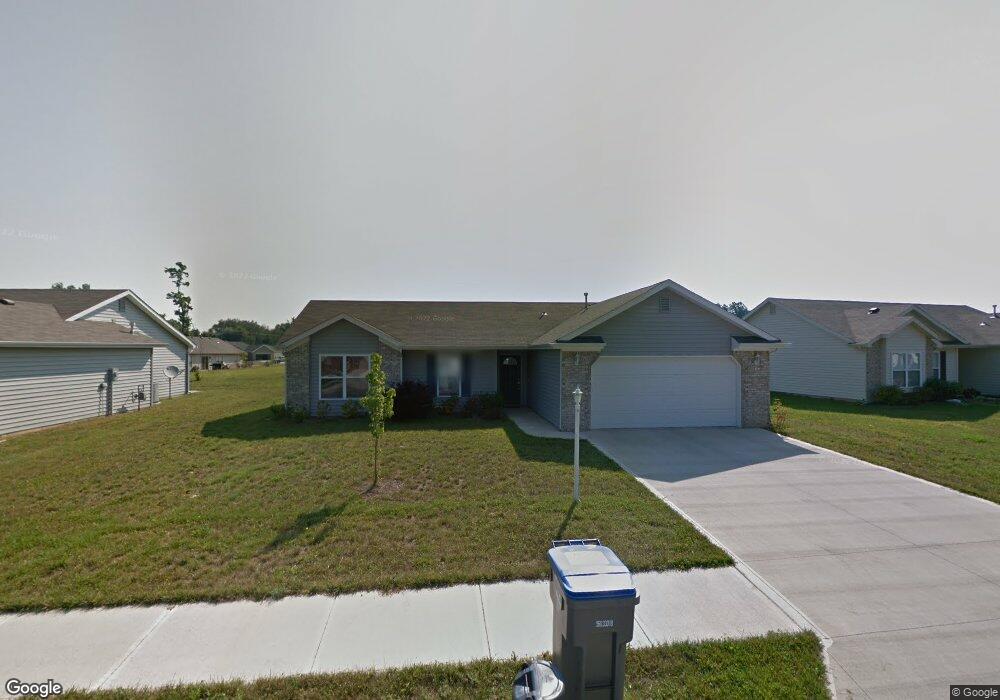
About This Home
This home is located at 676 Stag Dr Unit 69POD, Warsaw, IN 46582 and is currently estimated at $256,252, approximately $213 per square foot. 676 Stag Dr Unit 69POD is a home located in Kosciusko County with nearby schools including Harrison Elementary School, Lakeview Middle School, and Warsaw Community High School.
Ownership History
Date
Name
Owned For
Owner Type
Purchase Details
Closed on
Aug 7, 2020
Sold by
James Bishop A and James Carly E
Bought by
Valencia Sabas G
Current Estimated Value
Home Financials for this Owner
Home Financials are based on the most recent Mortgage that was taken out on this home.
Original Mortgage
$163,400
Outstanding Balance
$145,215
Interest Rate
3.1%
Mortgage Type
New Conventional
Estimated Equity
$111,037
Purchase Details
Closed on
Oct 20, 2017
Sold by
John
Bought by
Bishop
Home Financials for this Owner
Home Financials are based on the most recent Mortgage that was taken out on this home.
Original Mortgage
$143,075
Interest Rate
3.78%
Mortgage Type
New Conventional
Purchase Details
Closed on
May 11, 2010
Sold by
Ideal Suburban Homes Inc
Bought by
Franklin John E
Home Financials for this Owner
Home Financials are based on the most recent Mortgage that was taken out on this home.
Original Mortgage
$127,084
Interest Rate
5.5%
Mortgage Type
FHA
Create a Home Valuation Report for This Property
The Home Valuation Report is an in-depth analysis detailing your home's value as well as a comparison with similar homes in the area
Home Values in the Area
Average Home Value in this Area
Purchase History
| Date | Buyer | Sale Price | Title Company |
|---|---|---|---|
| Valencia Sabas G | $172,000 | Fidelity National Title Compan | |
| Bishop | $147,500 | -- | |
| James Bishop A | $147,500 | Fidelity National Title Co | |
| Franklin John E | -- | None Available | |
| Ideal Suburban Homes Inc | -- | None Available |
Source: Public Records
Mortgage History
| Date | Status | Borrower | Loan Amount |
|---|---|---|---|
| Open | Valencia Sabas G | $163,400 | |
| Previous Owner | James Bishop A | $143,075 | |
| Previous Owner | Franklin John E | $127,084 |
Source: Public Records
Tax History Compared to Growth
Tax History
| Year | Tax Paid | Tax Assessment Tax Assessment Total Assessment is a certain percentage of the fair market value that is determined by local assessors to be the total taxable value of land and additions on the property. | Land | Improvement |
|---|---|---|---|---|
| 2024 | $2,369 | $228,800 | $34,200 | $194,600 |
| 2023 | $2,186 | $211,100 | $34,200 | $176,900 |
| 2022 | $2,045 | $196,900 | $34,200 | $162,700 |
| 2021 | $1,799 | $172,700 | $34,200 | $138,500 |
| 2020 | $1,650 | $157,900 | $34,200 | $123,700 |
| 2019 | $1,581 | $151,200 | $34,200 | $117,000 |
| 2018 | $1,540 | $147,100 | $34,200 | $112,900 |
| 2017 | $1,485 | $141,600 | $34,200 | $107,400 |
| 2016 | $1,432 | $136,500 | $28,800 | $107,700 |
| 2014 | $1,315 | $132,700 | $28,800 | $103,900 |
| 2013 | $1,315 | $130,100 | $28,800 | $101,300 |
Source: Public Records
Map
Nearby Homes
- 3058 Deerfield Path
- 204 Sandpoint Dr
- 897 N Old Orchard Dr
- 2517 Oriole Ln
- 3835 Gregory Ct
- 419 N Roosevelt St
- 3750 Mitchells Blvd
- 2645 Nature View Dr
- 2629 Nature View Dr
- 1142 N Shagbark Dr
- 89 N Cheyenne Dr
- 225 S Cleveland St
- 1934 Sheridan St
- TBD Lake Tahoe Trail
- TBD Superior Ave
- 108 3rd St
- 401 College Ave
- 106 3rd St
- TBD N 175 E
- 309 7th St
- 676 Stag Dr
- 700 Stag Dr Unit 68POD
- 700 Stag Dr
- 658 Stag Dr Unit 70 POD
- 658 Stag Dr
- 3214 Fawn Ct Unit Lot 60POD
- 3214 Fawn Ct
- 3228 Fawn Ct Unit Lot 61POD
- 720 Stag Dr
- 720 Stag Dr Unit 67POD
- 644 Stag Dr Unit 71 POD
- 685 Stag Dr
- 685 Stag Dr Unit 75POD
- 3207 Deerfield Path
- 3207 Fawn Ct
- 3171 Deerfield Path Unit 76POD
- 647 Stag Dr Unit 73POD
- 3225 Deerfield Path Unit 65POD
- 3171 Deerfield Path Unit 76POD
- 671 Stag Dr Unit 74POD