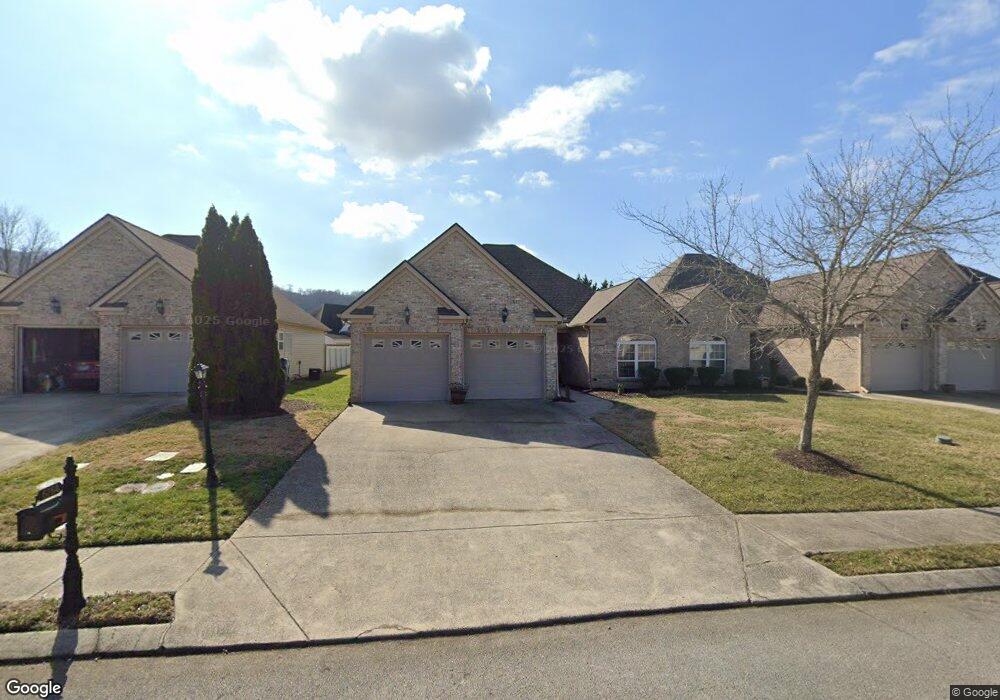
6764 Dove Field Rd Unit 134 Hixson, TN 37343
Estimated Value: $392,000 - $410,000
--
Bed
2
Baths
1,749
Sq Ft
$230/Sq Ft
Est. Value
About This Home
This home is located at 6764 Dove Field Rd Unit 134, Hixson, TN 37343 and is currently estimated at $401,447, approximately $229 per square foot. 6764 Dove Field Rd Unit 134 is a home located in Hamilton County with nearby schools including Ganns Middle Valley Elementary School, Hixson Middle School, and Hixson High School.
Ownership History
Date
Name
Owned For
Owner Type
Purchase Details
Closed on
Mar 12, 2014
Sold by
Thurow Jeffrey A
Bought by
Butler Bennie E and Butler Elaine A
Current Estimated Value
Home Financials for this Owner
Home Financials are based on the most recent Mortgage that was taken out on this home.
Original Mortgage
$71,900
Outstanding Balance
$54,518
Interest Rate
4.35%
Mortgage Type
New Conventional
Estimated Equity
$346,929
Purchase Details
Closed on
Apr 17, 2013
Sold by
Thurow Amy Lynn
Bought by
Thurow Jeffrey A
Purchase Details
Closed on
Apr 5, 2013
Sold by
Thurow Patricia Myers and Thurow Ronald P
Bought by
Thurow Jeffrey A
Purchase Details
Closed on
Feb 15, 2006
Sold by
Bell Engineering Co Inc
Bought by
Thurow Ronald P
Home Financials for this Owner
Home Financials are based on the most recent Mortgage that was taken out on this home.
Original Mortgage
$172,700
Interest Rate
5.75%
Mortgage Type
Fannie Mae Freddie Mac
Create a Home Valuation Report for This Property
The Home Valuation Report is an in-depth analysis detailing your home's value as well as a comparison with similar homes in the area
Home Values in the Area
Average Home Value in this Area
Purchase History
| Date | Buyer | Sale Price | Title Company |
|---|---|---|---|
| Butler Bennie E | $188,900 | None Available | |
| Thurow Jeffrey A | -- | None Available | |
| Thurow Jeffrey A | -- | None Available | |
| Thurow Ronald P | $191,900 | Pioneer Title Agency Inc |
Source: Public Records
Mortgage History
| Date | Status | Borrower | Loan Amount |
|---|---|---|---|
| Open | Butler Bennie E | $71,900 | |
| Previous Owner | Thurow Ronald P | $172,700 |
Source: Public Records
Tax History Compared to Growth
Tax History
| Year | Tax Paid | Tax Assessment Tax Assessment Total Assessment is a certain percentage of the fair market value that is determined by local assessors to be the total taxable value of land and additions on the property. | Land | Improvement |
|---|---|---|---|---|
| 2024 | $1,377 | $61,550 | $0 | $0 |
| 2023 | $1,395 | $61,550 | $0 | $0 |
| 2022 | $1,386 | $61,550 | $0 | $0 |
| 2021 | $1,386 | $61,550 | $0 | $0 |
| 2020 | $1,466 | $52,700 | $0 | $0 |
| 2019 | $1,466 | $52,700 | $0 | $0 |
| 2018 | $1,466 | $52,700 | $0 | $0 |
| 2017 | $1,466 | $52,700 | $0 | $0 |
| 2016 | $1,345 | $0 | $0 | $0 |
| 2015 | $1,345 | $48,300 | $0 | $0 |
| 2014 | $1,345 | $0 | $0 | $0 |
Source: Public Records
Map
Nearby Homes
- 6853 Manassas Gap Ln
- 6877 Manassas Gap Ln
- 1341 Jackson Mill Dr
- 6928 Dunker Church Ct
- 6970 Bullock Way
- 1760 Gaines Mill Way
- 1217 Little Sorrel Rd
- 38 Little Sorrel Rd
- 045 Little Sorrel Rd
- 1318 Little Sorrel Rd
- 104 Charming Place
- 1125 Little Sorrel Rd
- 1358 Little Sorrel Rd
- 7705 Evan Way
- 1399 Little Sorrel Rd
- 6213 Musket Ln
- 1963 Thrasher Pike
- 227 Charming Place
- 184 Charming Place
- 1983 Thrasher Pike
- 6764 Dove Field Rd
- 6772 Dove Field Rd
- 6772 Dove Field Rd Unit 135
- 6756 Dove Field Rd
- 6756 Dove Field Rd Unit 133
- 6748 Dove Field Rd
- 6748 Dove Field Rd Unit 132
- 6786 Dove Field Rd
- 6786 Dove Field Rd Unit 136
- 6740 Dove Field Rd
- 6740 Dove Field Rd Unit 131
- 6823 Manassas Gap Ln
- 6829 Manassas Gap Ln
- 6817 Manassas Gap Ln
- 1323 Jackson Mill Dr
- 1323 Jackson Mill Dr Unit 122
- 1335 Jackson Mill Dr
- 1335 Jackson Mill Dr Unit 121
- 1319 Jackson Mill Dr
- 1319 Jackson Mill Dr Unit 123