$307,000 - $341,168
RENTED OCT 29, 2024

677 Constellation Square SE Unit C Leesburg, VA 20175

2 Beds
2 Baths
1,035 Sq Ft
$317 Price per Sq Ft

Last Sold March 16, 2020

Last sale price $227,350 $220 Per Sq Ft

Est. 44% increase in value since last sale

Current estimated payment $2,260/month

About This Home

As of March 2020

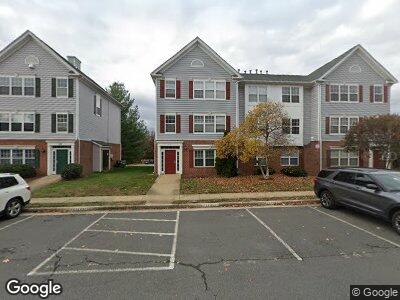
Top Floor Penthouse Unit - 2 Bedrooms 2 Baths. The unit has new appliances, new carpet, and fresh paint. 1 Assigned parking spot + plenty of visitor parking. Sought after Leesburg Gateway community has a pool, tennis court, and gym. Available November 1 ,2024!

Ownership History

Date Name Owned For Owner Type

Purchase Details

Listed on
Mar 19, 2020
Closed on
Mar 18, 2020
Sold by
Atwood Alexander R
Bought by
Aaj Investments Llc
Seller's Agent
Mijad Mujkic
Samson Properties
Buyer's Agent
datacorrect BrightMLS
Non Subscribing Office
Sold Price
$1,600
Current Estimated Value
$327,792

Home Financials for this Owner

Home Financials are based on the most recent Mortgage that was taken out on this home.
Estimated Appreciation
$326,192
Avg. Annual Appreciation
7.35%

Purchase Details

Closed on
Jan 10, 2005
Sold by
Gregory John J
Bought by
Atwood Alexander R

Home Financials for this Owner

Home Financials are based on the most recent Mortgage that was taken out on this home.
Original Mortgage
$199,500
Interest Rate
5.75%
Mortgage Type
New Conventional

Purchase Details

Closed on
Dec 18, 1998
Sold by
Chiang James L
Bought by
Gregory John J

Home Financials for this Owner

Home Financials are based on the most recent Mortgage that was taken out on this home.
Original Mortgage
$92,150
Interest Rate
6.85%
Mortgage Type
Purchase Money Mortgage

Range of Values:

Collateral Analytics

Collateral Analytics Collateral Analytics AVMs (Automated Valuation Model) employ a number of statistical approaches combined with neighborhood-specific comparable selection guarantees the most up-to-date and precise valuations.

Not Available

Collateral Analytics does not have data for the current month. Please view the chart for historical values.

ICE

ICE Mortgage Technology ICE Mortgage Technology’s AVM (Automated Valuation Model) is a state-of-the-art online residential property valuation tool that provides a quick and accurate estimate of the value of almost any home in the U.S.

Not Available

ICE Mortgage Technology does not have data for the current month. Please view the chart for historical values.

First American

First American First American Data & Analytics’ next-generation AVM combines unrivaled data assets with a blended ensemble of valuation models to produce highly accurate, reliable valuations you can trust.

Not Available

First American does not have data for the current month. Please view the chart for historical values.

Quantarium

Quantarium Quantarium’s valuation service, repeatedly proven the industry’s most accurate and comprehensive, is supercharged with a self-learning and auto-tuning AI engine that continually becomes smarter and more accurate as it processes daily inputs from the industry’s leading RE data lake.

Not Available

Quantarium does not have data for the current month. Please view the chart for historical values.

Average Value
Not Available
List Price
Sold Price
Create a Home Valuation Report for This Property
The Home Valuation Report is an in-depth analysis detailing your home's value as well as a comparison with similar homes in the area

Home Values in the Area

Source: Public Records

Average Home Value in this Area


Source: Public Records

Purchase History

Date Buyer Sale Price Title Company
Aaj Investments Llc $227,350 Advantage Settlement Inc
Atwood Alexander R $210,000 --
Gregory John J $97,000 --
Source: Public Records

Mortgage History

Date Status Borrower Loan Amount
Previous Owner Atwood Alexander R $199,500
Previous Owner Gregory John J $92,150
Source: Public Records

Property History

Date Event Price Change Sq Ft Price
10/29/2024 10/29/24 Rented $2,000 -7.0% --
10/18/2024 10/18/24 Under Contract -- -- --
09/25/2024 09/25/24 For Rent $2,150 +34.4% --
03/23/2020 03/23/20 Rented $1,600 0.0% --
03/19/2020 03/19/20 For Rent $1,600 0.0% --
03/16/2020 03/16/20 Sold $227,350 +3.4% $220 / Sq Ft
03/08/2020 03/08/20 Pending -- -- --
03/04/2020 03/04/20 For Sale $219,900 -- $212 / Sq Ft

Tax History Compared to Growth

Source: Public Records

Tax History

Year Tax Paid Tax Assessment Tax Assessment Total Assessment is a certain percentage of the fair market value that is determined by local assessors to be the total taxable value of land and additions on the property. Land Improvement
2024 $2,489 $287,690 $90,000 $197,690
2023 $2,427 $277,340 $90,000 $187,340
2022 $2,347 $263,720 $65,000 $198,720
2021 $2,164 $220,780 $50,000 $170,780
2020 $2,081 $201,110 $50,000 $151,110
2019 $2,060 $197,150 $45,000 $152,150
2018 $2,098 $193,400 $45,000 $148,400
2017 $2,068 $183,860 $45,000 $138,860
2016 $2,093 $182,800 $0 $0
2015 $335 $137,800 $0 $137,800
2014 $319 $129,320 $0 $129,320
Source: Public Records

Agents Affiliated with this Home

  • Section Image
  • Section Image
See All Agents

Map