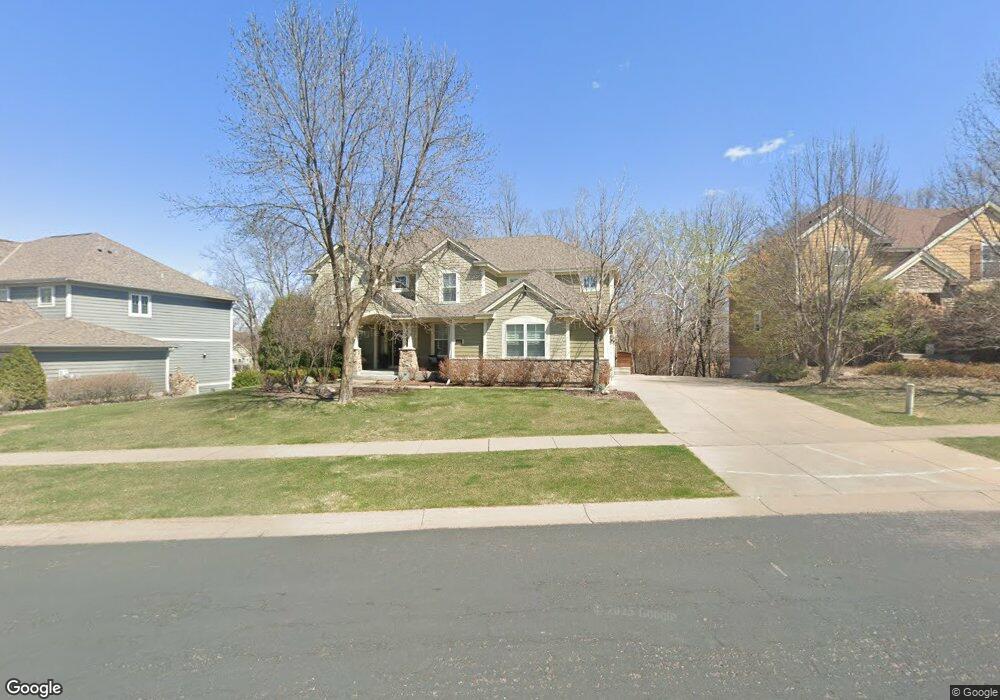
6774 Garland Ln N Maple Grove, MN 55311
Estimated Value: $813,067 - $870,000
5
Beds
5
Baths
5,010
Sq Ft
$167/Sq Ft
Est. Value
About This Home
This home is located at 6774 Garland Ln N, Maple Grove, MN 55311 and is currently estimated at $836,517, approximately $166 per square foot. 6774 Garland Ln N is a home located in Hennepin County with nearby schools including Basswood Elementary School, Maple Grove Middle School, and Maple Grove Senior High School.
Ownership History
Date
Name
Owned For
Owner Type
Purchase Details
Closed on
Oct 30, 2020
Sold by
Clayton Laurie A and Clayton Ricky W
Bought by
Bauer Sarah and Bauer Anthony L
Current Estimated Value
Home Financials for this Owner
Home Financials are based on the most recent Mortgage that was taken out on this home.
Original Mortgage
$510,400
Outstanding Balance
$453,146
Interest Rate
2.8%
Mortgage Type
New Conventional
Estimated Equity
$383,371
Purchase Details
Closed on
Sep 30, 2008
Sold by
Pulte Homes Of Minnesota Llc
Bought by
Clayton Ricky W and Clayton Laurie A
Create a Home Valuation Report for This Property
The Home Valuation Report is an in-depth analysis detailing your home's value as well as a comparison with similar homes in the area
Home Values in the Area
Average Home Value in this Area
Purchase History
| Date | Buyer | Sale Price | Title Company |
|---|---|---|---|
| Bauer Sarah | $664,000 | Guardian Title Llc | |
| Clayton Ricky W | $620,000 | -- | |
| Bauer Anthony Anthony | $664,000 | -- |
Source: Public Records
Mortgage History
| Date | Status | Borrower | Loan Amount |
|---|---|---|---|
| Open | Bauer Sarah | $510,400 | |
| Closed | Bauer Anthony Anthony | $567,163 |
Source: Public Records
Tax History Compared to Growth
Tax History
| Year | Tax Paid | Tax Assessment Tax Assessment Total Assessment is a certain percentage of the fair market value that is determined by local assessors to be the total taxable value of land and additions on the property. | Land | Improvement |
|---|---|---|---|---|
| 2024 | $9,560 | $738,400 | $189,300 | $549,100 |
| 2023 | $9,470 | $757,000 | $201,400 | $555,600 |
| 2022 | $7,205 | $736,700 | $135,600 | $601,100 |
| 2021 | $7,143 | $577,700 | $100,100 | $477,600 |
| 2020 | $7,476 | $565,400 | $102,100 | $463,300 |
| 2019 | $7,461 | $562,600 | $102,100 | $460,500 |
| 2018 | $7,611 | $534,800 | $92,100 | $442,700 |
| 2017 | $7,705 | $521,700 | $110,000 | $411,700 |
| 2016 | $7,775 | $519,400 | $117,000 | $402,400 |
| 2015 | $7,714 | $504,200 | $117,000 | $387,200 |
| 2014 | -- | $473,200 | $117,000 | $356,200 |
Source: Public Records
Map
Nearby Homes
- 6726 Fountain Ln N
- 6829 Narcissus Ln N Unit 304
- 6508 Merrimac Ln N Unit 6508
- 17812 66th Ave N
- 17225 72nd Ave N Unit 2001
- 17716 Elm Rd N
- 7087 Merrimac Ln N
- 17390 72nd Ave N Unit 1301
- 17700 71st Ave N
- 6647 Peony Ln N
- 16322 70th Ave N Unit 204
- 16314 70th Ave N
- 6324 Fountain Ln N
- 6413 Archer Ln N
- 16236 70th Place N
- 18165 67th Place N
- 6336 Yuma Ln N
- 7099 Weston Ln N
- 6848 Troy Ln N
- 7082 Weston Ln N
- 6774 Garland Ln N
- 6752 Garland Ln N
- 6796 Garland Ln N
- 6796 Garland Ln N
- 16942 68th Ave N
- 6727 Fountain Ln N
- 6751 Garland Ln N
- 6751 Garland Ln N
- 6739 Fountain Ln N
- 6801 Garland Ln N
- 6801 Garland Ln N
- 6795 Garland Ln N
- 6795 Garland Ln N
- 6751 Fountain Ln N
- 6775 Fountain Ln N
- 17142 67th Place N
- 6206 6206 Fountain Ln N
- 17000 68th Ave N
- 6763 Fountain Ln N
- 6737 Garland Ln N