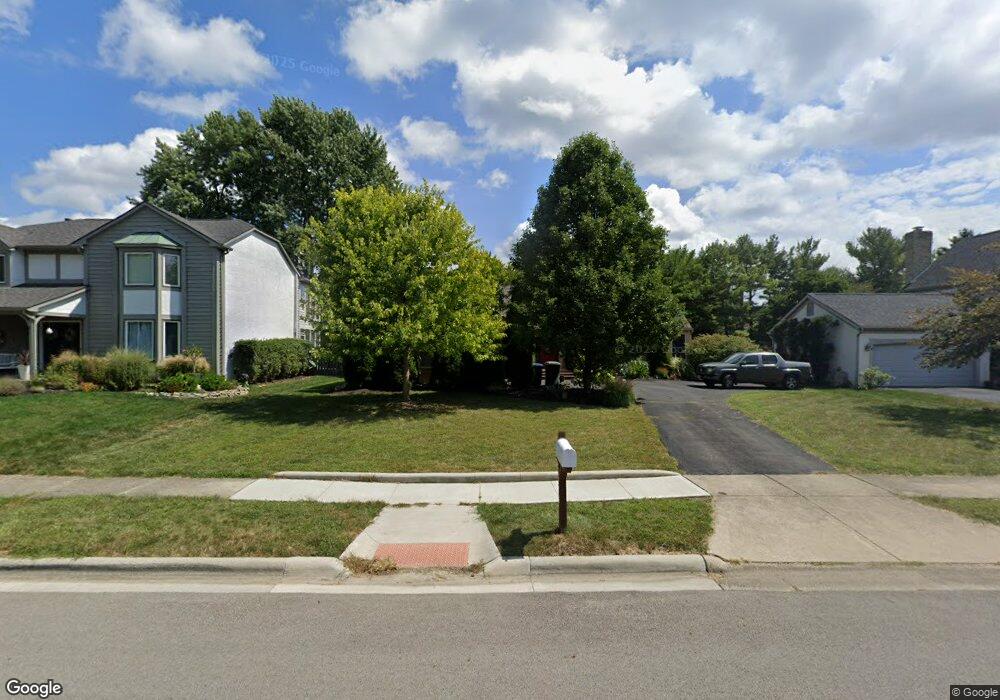
6774 Maplebrook Ln Columbus, OH 43235
Brookside Woods NeighborhoodEstimated Value: $418,000 - $518,000
3
Beds
2
Baths
1,866
Sq Ft
$245/Sq Ft
Est. Value
About This Home
This home is located at 6774 Maplebrook Ln, Columbus, OH 43235 and is currently estimated at $457,413, approximately $245 per square foot. 6774 Maplebrook Ln is a home located in Franklin County with nearby schools including Brookside Elementary School, McCord Middle School, and Worthington Kilbourne High School.
Ownership History
Date
Name
Owned For
Owner Type
Purchase Details
Closed on
Aug 27, 2007
Sold by
Long Basil W and Long Rodney C
Bought by
Miazga Scott H
Current Estimated Value
Home Financials for this Owner
Home Financials are based on the most recent Mortgage that was taken out on this home.
Original Mortgage
$182,500
Outstanding Balance
$116,373
Interest Rate
6.71%
Mortgage Type
Purchase Money Mortgage
Estimated Equity
$341,040
Purchase Details
Closed on
Jul 21, 1989
Bought by
Long Basil W and Long Evaleen
Purchase Details
Closed on
Jul 1, 1985
Purchase Details
Closed on
Aug 1, 1980
Create a Home Valuation Report for This Property
The Home Valuation Report is an in-depth analysis detailing your home's value as well as a comparison with similar homes in the area
Home Values in the Area
Average Home Value in this Area
Purchase History
| Date | Buyer | Sale Price | Title Company |
|---|---|---|---|
| Miazga Scott H | $182,500 | Title First | |
| Long Basil W | $145,000 | -- | |
| -- | $123,500 | -- | |
| -- | $10,800 | -- |
Source: Public Records
Mortgage History
| Date | Status | Borrower | Loan Amount |
|---|---|---|---|
| Open | Miazga Scott H | $182,500 |
Source: Public Records
Tax History Compared to Growth
Tax History
| Year | Tax Paid | Tax Assessment Tax Assessment Total Assessment is a certain percentage of the fair market value that is determined by local assessors to be the total taxable value of land and additions on the property. | Land | Improvement |
|---|---|---|---|---|
| 2024 | $7,201 | $117,290 | $33,880 | $83,410 |
| 2023 | $6,886 | $117,285 | $33,880 | $83,405 |
| 2022 | $5,920 | $80,010 | $18,550 | $61,460 |
| 2021 | $5,462 | $80,010 | $18,550 | $61,460 |
| 2020 | $5,261 | $80,010 | $18,550 | $61,460 |
| 2019 | $5,009 | $68,750 | $16,140 | $52,610 |
| 2018 | $5,065 | $68,750 | $16,140 | $52,610 |
| 2017 | $4,489 | $68,750 | $16,140 | $52,610 |
| 2016 | $5,276 | $74,310 | $20,580 | $53,730 |
| 2015 | $5,277 | $74,310 | $20,580 | $53,730 |
| 2014 | $5,275 | $74,310 | $20,580 | $53,730 |
| 2013 | $2,624 | $74,305 | $20,580 | $53,725 |
Source: Public Records
Map
Nearby Homes
- 6755 Meadow Creek Dr Unit 103
- 6755 Meadow Creek Dr Unit 207
- 2546 Timberside Dr Unit 2546
- 2548 Timberside Dr Unit 2548
- 6637 Merwin Rd
- 6876 Spruce Pine Dr
- 7373 Palmleaf Ln
- 6921 Spruce Pine Dr
- 6550 Winston Ct E
- 2687 Snouffer Rd
- 2161 Heatherfield Ave
- 7456 Mapleleaf Ct
- 2056 Fincastle Ct
- 7385 Cimmaron Station
- 3002 Glenloch Cir Unit 3002
- 2946 Sawdust Ln
- 1930 Shallowford Ave
- 2960 Sawdust Ln Unit 2960
- 1307 Lakeside Ct
- 2951 Cranston Dr Unit 2953
- 6766 Maplebrook Ln
- 6767 Oakfair Ave
- 6779 Oakfair Ave
- 6758 Maplebrook Ln
- 6796 Maplebrook Ln
- 6759 Oakfair Ave
- 6787 Maplebrook Ln
- 6791 Oakfair Ave
- 6765 Maplebrook Ln
- 6746 Maplebrook Ln
- 6795 Maplebrook Ln
- 6804 Maplebrook Ln
- 6745 Oakfair Ave
- 6799 Oakfair Ave
- 6753 Maplebrook Ln
- 6803 Maplebrook Ln
- 2208 London Plane Dr
- 6734 Maplebrook Ln
- 2209 London Plane Dr
- 6745 Maplebrook Ln