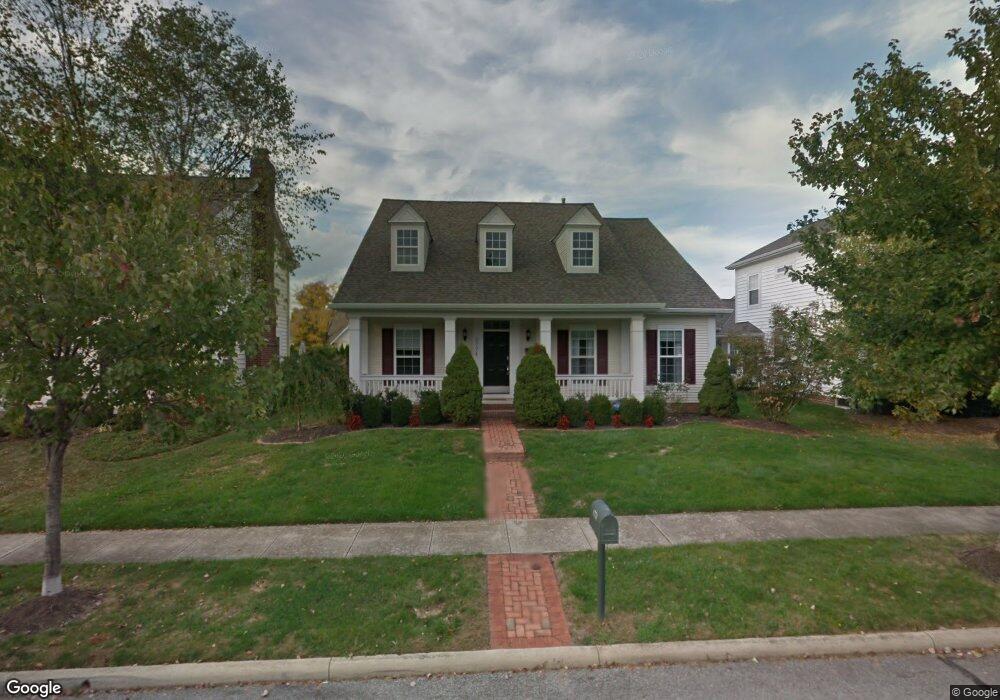
6774 Upper Brook Way Unit 105 New Albany, OH 43054
Fodor NeighborhoodEstimated Value: $620,000 - $660,000
4
Beds
3
Baths
2,500
Sq Ft
$255/Sq Ft
Est. Value
About This Home
This home is located at 6774 Upper Brook Way Unit 105, New Albany, OH 43054 and is currently estimated at $636,652, approximately $254 per square foot. 6774 Upper Brook Way Unit 105 is a home located in Franklin County with nearby schools including New Albany Primary School, New Albany Intermediate School, and New Albany Middle School.
Ownership History
Date
Name
Owned For
Owner Type
Purchase Details
Closed on
Nov 26, 2024
Sold by
Stang Wendy and Stang Douglas J
Bought by
Stang Family Trust and Stang
Current Estimated Value
Purchase Details
Closed on
Jul 28, 2022
Sold by
Roca Franklin Arthur J and Roca Natalia
Bought by
Stang Douglas and Stang Wendy
Purchase Details
Closed on
Jun 15, 2015
Sold by
Finn Marilyn A
Bought by
Chereny Roca Natalia and Roca Arthur J
Home Financials for this Owner
Home Financials are based on the most recent Mortgage that was taken out on this home.
Original Mortgage
$241,575
Interest Rate
0.78%
Mortgage Type
New Conventional
Purchase Details
Closed on
Nov 30, 1998
Sold by
M/I Schottenstein Homes Inc
Bought by
Finn William J and Finn Marilyn A
Create a Home Valuation Report for This Property
The Home Valuation Report is an in-depth analysis detailing your home's value as well as a comparison with similar homes in the area
Home Values in the Area
Average Home Value in this Area
Purchase History
| Date | Buyer | Sale Price | Title Company |
|---|---|---|---|
| Stang Family Trust | -- | None Listed On Document | |
| Stang Family Trust | -- | None Listed On Document | |
| Stang Douglas | $577,000 | Chicago Title | |
| Chereny Roca Natalia | $322,100 | Northwest Title Family Of Co | |
| Finn William J | $239,400 | Transohio Residential Title |
Source: Public Records
Mortgage History
| Date | Status | Borrower | Loan Amount |
|---|---|---|---|
| Previous Owner | Chereny Roca Natalia | $241,575 |
Source: Public Records
Tax History Compared to Growth
Tax History
| Year | Tax Paid | Tax Assessment Tax Assessment Total Assessment is a certain percentage of the fair market value that is determined by local assessors to be the total taxable value of land and additions on the property. | Land | Improvement |
|---|---|---|---|---|
| 2024 | $9,833 | $180,820 | $43,650 | $137,170 |
| 2023 | $9,748 | $180,810 | $43,645 | $137,165 |
| 2022 | $9,007 | $127,370 | $24,960 | $102,410 |
| 2021 | $8,636 | $127,370 | $24,960 | $102,410 |
| 2020 | $8,567 | $127,370 | $24,960 | $102,410 |
| 2019 | $7,765 | $104,930 | $20,790 | $84,140 |
| 2018 | $7,671 | $104,930 | $20,790 | $84,140 |
| 2017 | $7,716 | $104,930 | $20,790 | $84,140 |
| 2016 | $7,666 | $95,340 | $19,390 | $75,950 |
| 2015 | $7,683 | $95,340 | $19,390 | $75,950 |
| 2014 | $6,669 | $95,340 | $19,390 | $75,950 |
| 2013 | $3,444 | $90,825 | $18,480 | $72,345 |
Source: Public Records
Map
Nearby Homes
- 6813 Ridge Rock Dr Unit 14
- 4774 Bosk Dr
- 5556 Falco Dr
- 5288 Abby Gate Ave Unit 16
- 7362 Tottenham Place
- 0 N Hamilton Rd
- 5450 Nottinghamshire Ln
- 5468 Nottinghamshire Ln
- 5396 Nottinghamshire Ln Unit 5396
- 5600 Apothecary Way
- 5604 Apothecary Way Unit 4
- 5478 Albany Terrace Way Unit 1405
- 5318 Nottinghamshire Ln Unit 5318
- 5656 Apothecary Way Unit 2
- 6929 Clivdon Mews
- 6923 Rothwell St Unit 46923
- 6501 Walnut Fork Dr Unit 6501
- 6455 Walnut Fork Dr Unit 6455
- 6931 Rothwell St Unit 36931
- 6498 Ash Rock Cir Unit 6498
- 6774 Upper Brook Way
- 6782 Upper Brook Way
- 6766 Upper Brook Way
- 6758 Upper Brook Way
- 6790 Upper Brook Way
- 6775 Headwater Trail
- 6783 Headwater Trail
- 6767 Headwater Trail
- 6791 Headwater Trail
- 6773 Upper Brook Way
- 6750 Upper Brook Way
- 6765 Upper Brook Way
- 6781 Upper Brook Way
- 6757 Upper Brook Way
- 6789 Upper Brook Way
- 6751 Headwater Trail
- 6749 Upper Brook Way
- 6742 Upper Brook Way
- 5204 Mount Row
- 5204 Mount Row Unit 101