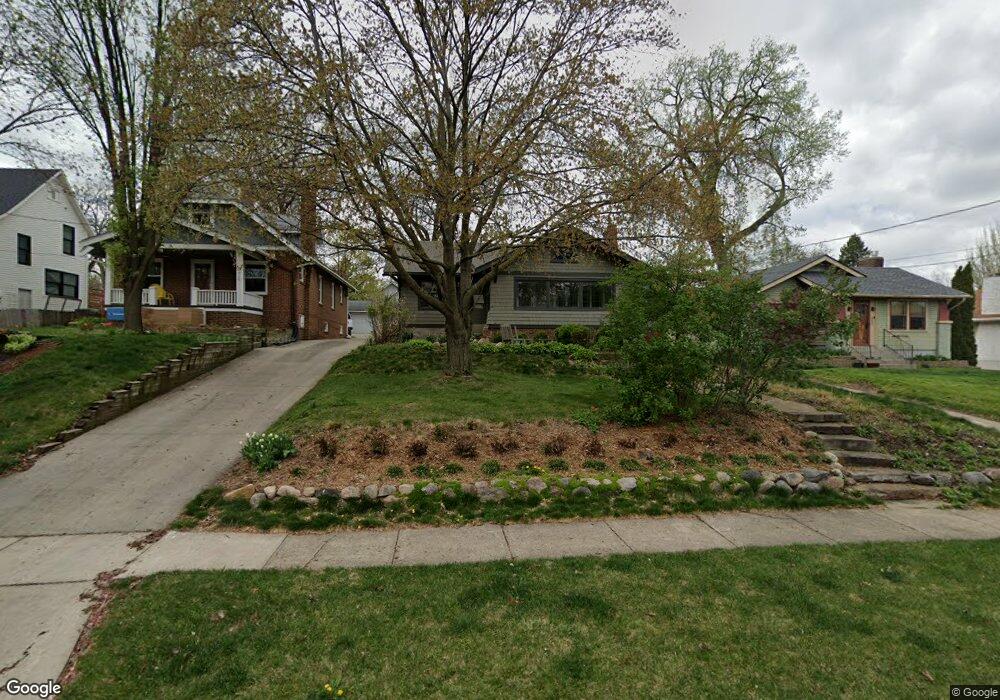
678 41st St Des Moines, IA 50312
North of Grand NeighborhoodEstimated Value: $211,918 - $227,000
2
Beds
1
Bath
1,079
Sq Ft
$206/Sq Ft
Est. Value
About This Home
This home is located at 678 41st St, Des Moines, IA 50312 and is currently estimated at $222,480, approximately $206 per square foot. 678 41st St is a home located in Polk County with nearby schools including Hubbell Elementary, Roosevelt High School, and Bergman Academy.
Ownership History
Date
Name
Owned For
Owner Type
Purchase Details
Closed on
Dec 9, 2013
Sold by
Clark Kathryn A and Clark Steven R
Bought by
Rels Kasey M
Current Estimated Value
Home Financials for this Owner
Home Financials are based on the most recent Mortgage that was taken out on this home.
Original Mortgage
$121,500
Outstanding Balance
$90,392
Interest Rate
4.17%
Mortgage Type
New Conventional
Estimated Equity
$132,088
Purchase Details
Closed on
Apr 14, 2008
Sold by
Clark Kathryn A and Clark Steven R
Bought by
Clark Kathryn A and Clark Steven R
Home Financials for this Owner
Home Financials are based on the most recent Mortgage that was taken out on this home.
Original Mortgage
$114,000
Interest Rate
6.09%
Mortgage Type
New Conventional
Purchase Details
Closed on
May 14, 2004
Sold by
Conner Dana S and Conner David R
Bought by
Reis Kathryn A
Home Financials for this Owner
Home Financials are based on the most recent Mortgage that was taken out on this home.
Original Mortgage
$116,000
Interest Rate
5.75%
Mortgage Type
Purchase Money Mortgage
Purchase Details
Closed on
Oct 12, 1999
Sold by
Holm Jacquie A
Bought by
Conner David R and Conner Dana S
Home Financials for this Owner
Home Financials are based on the most recent Mortgage that was taken out on this home.
Original Mortgage
$78,300
Interest Rate
8%
Purchase Details
Closed on
Jun 11, 1998
Sold by
Petty Linda J and Petty Rua M
Bought by
Holm Jacquie A
Create a Home Valuation Report for This Property
The Home Valuation Report is an in-depth analysis detailing your home's value as well as a comparison with similar homes in the area
Home Values in the Area
Average Home Value in this Area
Purchase History
| Date | Buyer | Sale Price | Title Company |
|---|---|---|---|
| Rels Kasey M | $135,000 | None Available | |
| Clark Kathryn A | -- | None Available | |
| Reis Kathryn A | $115,500 | -- | |
| Conner David R | $86,500 | -- | |
| Holm Jacquie A | -- | -- |
Source: Public Records
Mortgage History
| Date | Status | Borrower | Loan Amount |
|---|---|---|---|
| Open | Rels Kasey M | $121,500 | |
| Previous Owner | Clark Kathryn A | $114,000 | |
| Previous Owner | Reis Kathryn A | $116,000 | |
| Previous Owner | Conner David R | $78,300 |
Source: Public Records
Tax History Compared to Growth
Tax History
| Year | Tax Paid | Tax Assessment Tax Assessment Total Assessment is a certain percentage of the fair market value that is determined by local assessors to be the total taxable value of land and additions on the property. | Land | Improvement |
|---|---|---|---|---|
| 2025 | $3,460 | $208,400 | $50,100 | $158,300 |
| 2024 | $3,460 | $186,300 | $44,500 | $141,800 |
| 2023 | $3,772 | $186,300 | $44,500 | $141,800 |
| 2022 | $3,740 | $168,900 | $42,200 | $126,700 |
| 2021 | $3,624 | $168,900 | $42,200 | $126,700 |
| 2020 | $3,758 | $153,800 | $38,600 | $115,200 |
| 2019 | $3,388 | $153,800 | $38,600 | $115,200 |
| 2018 | $3,348 | $134,600 | $33,300 | $101,300 |
| 2017 | $2,994 | $134,600 | $33,300 | $101,300 |
| 2016 | $2,912 | $119,200 | $29,300 | $89,900 |
| 2015 | $2,912 | $119,200 | $29,300 | $89,900 |
| 2014 | $2,896 | $117,700 | $28,900 | $88,800 |
Source: Public Records
Map
Nearby Homes
- 689 42nd St
- 4012 Pleasant St
- 620 40th St
- 3908 Pleasant St
- 725 40th St
- 529 43rd St
- 3920 Grand Ave Unit 2TW
- 3920 Grand Ave Unit 5TE
- 744 37th St
- 4345 Grand Ave Unit 1
- 4323 Grand Ave Unit 216
- 4323 Grand Ave Unit 101
- 702 45th Place
- 4341 Grand Ave Unit 4
- 4303 Crocker St
- 870 39th St
- 415 42nd St
- 3930 Grand Ave Unit 308
- 1001 42nd St
- 708 35th St