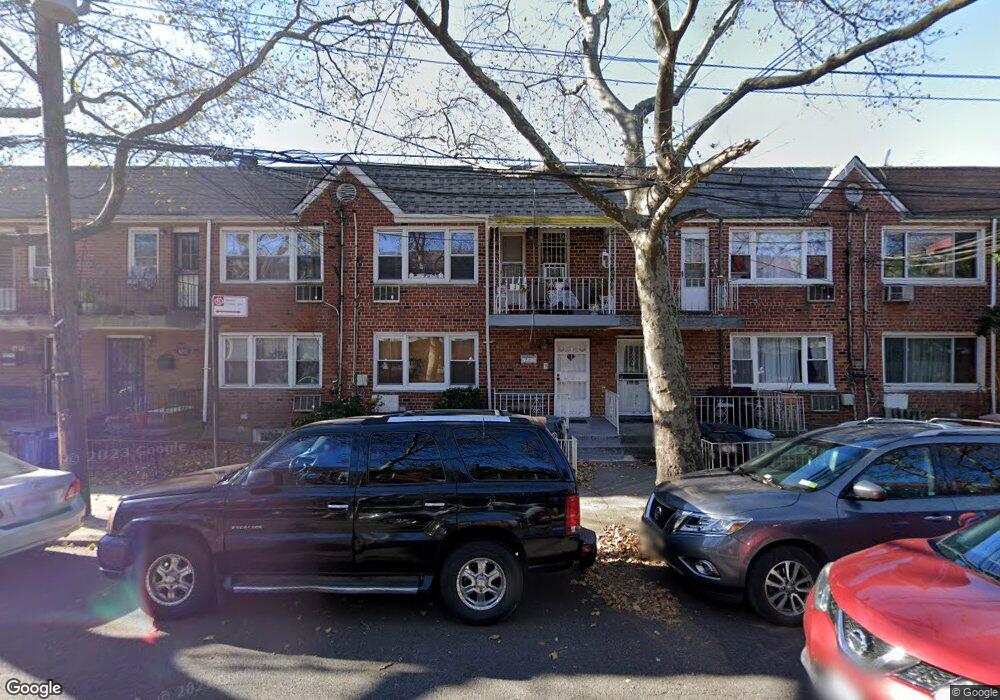
678 E 58th St Brooklyn, NY 11234
Flatlands NeighborhoodEstimated Value: $738,651 - $983,000
Studio
--
Bath
2,376
Sq Ft
$375/Sq Ft
Est. Value
About This Home
This home is located at 678 E 58th St, Brooklyn, NY 11234 and is currently estimated at $891,913, approximately $375 per square foot. 678 E 58th St is a home located in Kings County with nearby schools including P.S. 208 Elsa Ebeling, I.S. 285 Meyer Levin, and Ivy Hill Preparatory Charter School.
Ownership History
Date
Name
Owned For
Owner Type
Purchase Details
Closed on
Jul 25, 2000
Sold by
The Chase Manhattan Bank
Bought by
Sixsmith Diane M
Current Estimated Value
Home Financials for this Owner
Home Financials are based on the most recent Mortgage that was taken out on this home.
Original Mortgage
$184,000
Outstanding Balance
$65,048
Interest Rate
8.06%
Estimated Equity
$826,865
Purchase Details
Closed on
Dec 15, 1999
Sold by
Cox Trevor
Bought by
Imc Home Equity Loan Trust 1995-3
Purchase Details
Closed on
Aug 25, 1995
Sold by
Scott Yvette
Bought by
Cox Trevor
Home Financials for this Owner
Home Financials are based on the most recent Mortgage that was taken out on this home.
Original Mortgage
$166,250
Interest Rate
7.89%
Create a Home Valuation Report for This Property
The Home Valuation Report is an in-depth analysis detailing your home's value as well as a comparison with similar homes in the area
Home Values in the Area
Average Home Value in this Area
Purchase History
| Date | Buyer | Sale Price | Title Company |
|---|---|---|---|
| Sixsmith Diane M | $230,000 | Commonwealth Land Title Ins | |
| Imc Home Equity Loan Trust 1995-3 | $220,500 | Commonwealth Land Title Ins | |
| Cox Trevor | $57,000 | Long Island Title Agency |
Source: Public Records
Mortgage History
| Date | Status | Borrower | Loan Amount |
|---|---|---|---|
| Open | Sixsmith Diane M | $184,000 | |
| Previous Owner | Cox Trevor | $166,250 |
Source: Public Records
Tax History
| Year | Tax Paid | Tax Assessment Tax Assessment Total Assessment is a certain percentage of the fair market value that is determined by local assessors to be the total taxable value of land and additions on the property. | Land | Improvement |
|---|---|---|---|---|
| 2025 | $7,303 | $47,700 | $11,220 | $36,480 |
| 2024 | $7,303 | $50,940 | $11,220 | $39,720 |
| 2023 | $7,384 | $55,320 | $11,220 | $44,100 |
| 2022 | $7,204 | $46,560 | $11,220 | $35,340 |
| 2021 | $7,165 | $35,940 | $11,220 | $24,720 |
| 2019 | $6,338 | $30,300 | $11,220 | $19,080 |
| 2018 | $7,001 | $34,344 | $9,500 | $24,844 |
| 2017 | $6,942 | $34,056 | $10,141 | $23,915 |
| 2016 | $6,794 | $33,984 | $11,033 | $22,951 |
| 2015 | $3,875 | $32,157 | $10,170 | $21,987 |
| 2014 | $3,875 | $30,337 | $9,594 | $20,743 |
Source: Public Records
Map
Nearby Homes
Your Personal Tour Guide
Ask me questions while you tour the home.