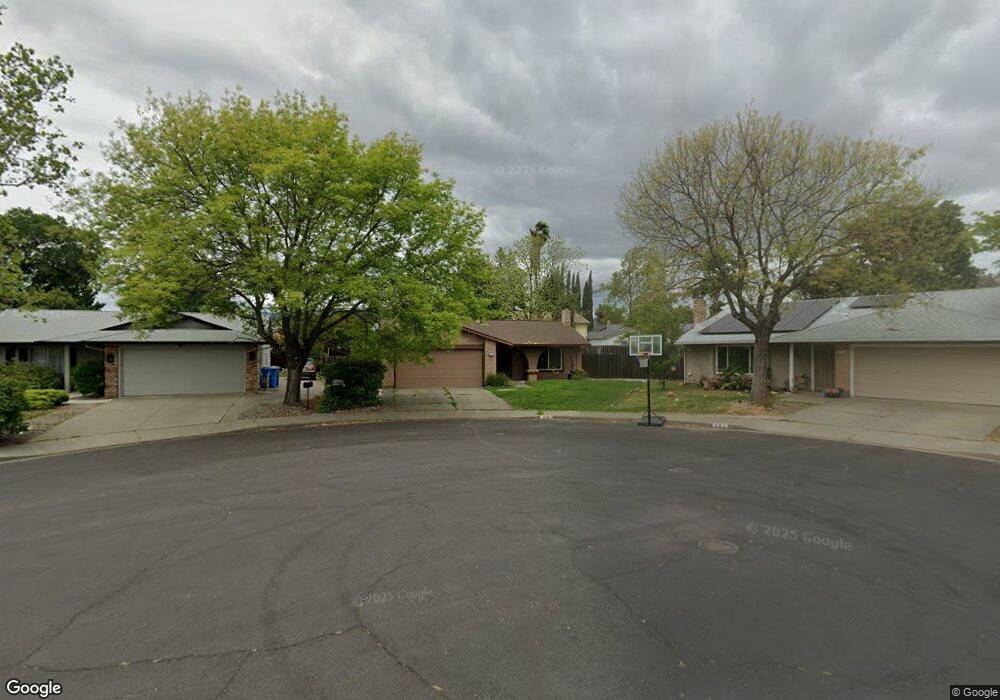
678 Kingman Ct Vacaville, CA 95687
Estimated Value: $469,000 - $532,000
3
Beds
2
Baths
1,099
Sq Ft
$458/Sq Ft
Est. Value
About This Home
This home is located at 678 Kingman Ct, Vacaville, CA 95687 and is currently estimated at $503,720, approximately $458 per square foot. 678 Kingman Ct is a home located in Solano County with nearby schools including Eugene Padan Elementary School, Orchard Elementary School, and Vaca Pena Middle School.
Ownership History
Date
Name
Owned For
Owner Type
Purchase Details
Closed on
Jul 22, 2011
Sold by
Munoz Fatima
Bought by
Mues Randy
Current Estimated Value
Home Financials for this Owner
Home Financials are based on the most recent Mortgage that was taken out on this home.
Original Mortgage
$116,000
Outstanding Balance
$79,616
Interest Rate
4.46%
Mortgage Type
New Conventional
Estimated Equity
$424,104
Purchase Details
Closed on
Mar 28, 2011
Sold by
Diosdado Jose and Diosdado Jose Jesus
Bought by
Munoz Fatima
Purchase Details
Closed on
May 24, 2005
Sold by
Blume Katherine and Laevastu Eva
Bought by
Diosdado Jose Jesus and Munoz Fatima
Home Financials for this Owner
Home Financials are based on the most recent Mortgage that was taken out on this home.
Original Mortgage
$25,000
Interest Rate
5.74%
Mortgage Type
Stand Alone Second
Purchase Details
Closed on
Jul 28, 1998
Sold by
Katherine Blume
Bought by
Blume Katherine and Laevastu Eva
Create a Home Valuation Report for This Property
The Home Valuation Report is an in-depth analysis detailing your home's value as well as a comparison with similar homes in the area
Home Values in the Area
Average Home Value in this Area
Purchase History
| Date | Buyer | Sale Price | Title Company |
|---|---|---|---|
| Mues Randy | $145,000 | Old Republic Title Company | |
| Munoz Fatima | -- | Old Republic Title Company | |
| Diosdado Jose Jesus | $399,500 | Fidelity Title Co | |
| Blume Katherine | -- | -- |
Source: Public Records
Mortgage History
| Date | Status | Borrower | Loan Amount |
|---|---|---|---|
| Open | Mues Randy | $116,000 | |
| Previous Owner | Diosdado Jose Jesus | $25,000 | |
| Previous Owner | Diosdado Jose Jesus | $319,600 |
Source: Public Records
Tax History Compared to Growth
Tax History
| Year | Tax Paid | Tax Assessment Tax Assessment Total Assessment is a certain percentage of the fair market value that is determined by local assessors to be the total taxable value of land and additions on the property. | Land | Improvement |
|---|---|---|---|---|
| 2025 | $2,204 | $182,118 | $75,358 | $106,760 |
| 2024 | $2,204 | $178,548 | $73,881 | $104,667 |
| 2023 | $2,151 | $175,048 | $72,433 | $102,615 |
| 2022 | $2,095 | $171,616 | $71,013 | $100,603 |
| 2021 | $2,096 | $168,252 | $69,621 | $98,631 |
| 2020 | $2,067 | $166,528 | $68,908 | $97,620 |
| 2019 | $2,030 | $163,263 | $67,557 | $95,706 |
| 2018 | $2,006 | $160,063 | $66,233 | $93,830 |
| 2017 | $1,940 | $156,926 | $64,935 | $91,991 |
| 2016 | $1,920 | $153,850 | $63,662 | $90,188 |
| 2015 | $1,896 | $151,540 | $62,706 | $88,834 |
| 2014 | $1,778 | $148,572 | $61,478 | $87,094 |
Source: Public Records
Map
Nearby Homes
- 678 Claremont Dr
- 1221 Devonshire Dr
- 632 Cordelia Cir
- 376 Bishop Dr
- 814 Kingman Dr
- 1057 Davis St
- 1217 Alderwood Way
- 259 Bowline Dr
- 731 La Cruz Ln
- 325 Gabiano Ct
- 491 Rosso Ct
- 0 Merchant St Unit 325089259
- 430 Burlington Dr
- 466 Bowline Dr
- 512 Davis St
- 1121 Creekside Dr
- 1597 Alamo Dr Unit 150
- 149 Fairoaks Dr
- 1173 Araquipa Ct
- 430 Manchester Way
- 674 Kingman Ct
- 682 Kingman Ct
- 670 Kingman Dr
- 675 Claremont Ct
- 686 Kingman Ct
- 666 Kingman Dr
- 687 Claremont Dr
- 683 Claremont Ct
- 690 Kingman Ct
- 694 Kingman Ct
- 671 Claremont Ct
- 691 Claremont Dr
- 683 Kingman Dr
- 662 Kingman Dr
- 679 Kingman Dr
- 687 Kingman Dr
- 675 Kingman Dr
- 695 Claremont Dr
- 691 Kingman Dr
- 667 Claremont Ct