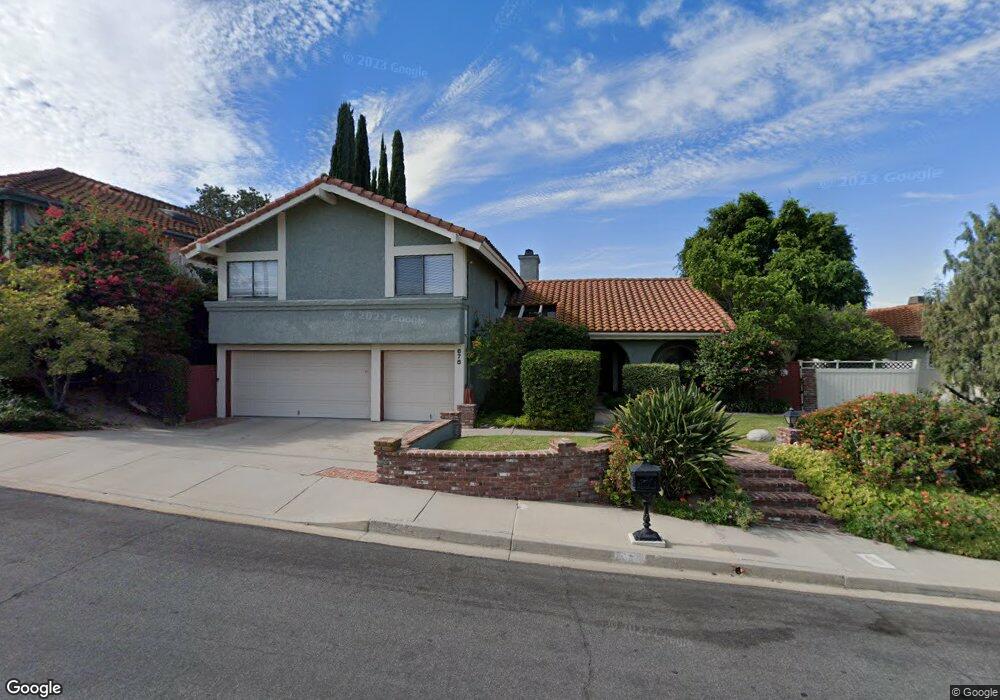
678 Whispering Oaks Place Newbury Park, CA 91320
Estimated Value: $1,122,000 - $1,365,117
4
Beds
3
Baths
2,760
Sq Ft
$437/Sq Ft
Est. Value
About This Home
This home is located at 678 Whispering Oaks Place, Newbury Park, CA 91320 and is currently estimated at $1,206,529, approximately $437 per square foot. 678 Whispering Oaks Place is a home located in Ventura County with nearby schools including Aspen Elementary School, Redwood Middle School, and Sequoia Middle School.
Ownership History
Date
Name
Owned For
Owner Type
Purchase Details
Closed on
Jun 5, 1997
Sold by
Downey S&L Assn Fa
Bought by
Blauvelt Franklin M and Blauvelt Suzanne G
Current Estimated Value
Home Financials for this Owner
Home Financials are based on the most recent Mortgage that was taken out on this home.
Original Mortgage
$255,000
Outstanding Balance
$36,364
Interest Rate
7.94%
Estimated Equity
$1,170,165
Purchase Details
Closed on
Mar 6, 1997
Sold by
Ferguson Erroll D and Ferguson Diane L
Bought by
Downey S&L Assn Fa
Purchase Details
Closed on
Feb 25, 1997
Sold by
Ferguson Diane
Bought by
Swanson David
Purchase Details
Closed on
Jan 4, 1997
Sold by
Ferguson Dianne L
Bought by
Sleeper Nolan
Create a Home Valuation Report for This Property
The Home Valuation Report is an in-depth analysis detailing your home's value as well as a comparison with similar homes in the area
Home Values in the Area
Average Home Value in this Area
Purchase History
| Date | Buyer | Sale Price | Title Company |
|---|---|---|---|
| Blauvelt Franklin M | $295,000 | Lawyers Title Company | |
| Downey S&L Assn Fa | $233,996 | Continental Lawyers Title Co | |
| Swanson David | -- | -- | |
| Sleeper Nolan | -- | -- |
Source: Public Records
Mortgage History
| Date | Status | Borrower | Loan Amount |
|---|---|---|---|
| Open | Blauvelt Franklin M | $255,000 |
Source: Public Records
Tax History Compared to Growth
Tax History
| Year | Tax Paid | Tax Assessment Tax Assessment Total Assessment is a certain percentage of the fair market value that is determined by local assessors to be the total taxable value of land and additions on the property. | Land | Improvement |
|---|---|---|---|---|
| 2025 | $5,919 | $480,430 | $192,166 | $288,264 |
| 2024 | $5,919 | $471,010 | $188,398 | $282,612 |
| 2023 | $5,737 | $461,775 | $184,704 | $277,071 |
| 2022 | $5,689 | $452,721 | $181,082 | $271,639 |
| 2021 | $5,493 | $443,845 | $177,532 | $266,313 |
| 2020 | $5,060 | $439,295 | $175,712 | $263,583 |
| 2019 | $4,924 | $430,682 | $172,267 | $258,415 |
| 2018 | $4,820 | $422,239 | $168,890 | $253,349 |
| 2017 | $4,720 | $413,961 | $165,579 | $248,382 |
| 2016 | $4,668 | $405,845 | $162,333 | $243,512 |
| 2015 | $4,581 | $399,751 | $159,896 | $239,855 |
| 2014 | $4,564 | $391,922 | $156,765 | $235,157 |
Source: Public Records
Map
Nearby Homes
- 325 Cherry Hills Ct
- 718 Pamela Wood St
- 607 Valley Oak Ln
- 816 Pamela Wood St
- 865 Palmgrove Ave
- 254 Greenmeadow Dr
- 722 Blue Oak Ave
- 656 Blue Oak Ave
- 214 Poplar Crest Ave
- 224 Marjori Ave
- 603 Racquet Club Ln
- 559 Racquet Club Ln
- 809 Shadow Lake Dr
- 216 Windrose Ct
- 1044 Larry Ct
- 1091 Amberton Ln Unit 58
- 1095 Amberton Ln
- 769 Birchpark Cir Unit 203
- 942 Woodlawn Dr
- 1047 Mountain Oak Place
- 684 Whispering Oaks Place
- 672 Whispering Oaks Place
- 690 Whispering Oaks Place
- 668 Whispering Oaks Place
- 256 Windtree Ave
- 696 Whispering Oaks Place
- 675 Whispering Oaks Place
- 244 Windtree Ave
- 669 Whispering Oaks Place
- 662 Whispering Oaks Place
- 268 Windtree Ave
- 679 Whispering Oaks Place
- 232 Windtree Ave
- 280 Windtree Ave
- 683 Whispering Oaks Place
- 220 Windtree Ave
- 689 Whispering Oaks Place
- 689 Whipsering Oaks Place
- 656 Whispering Oaks Place
- 292 Windtree Ave