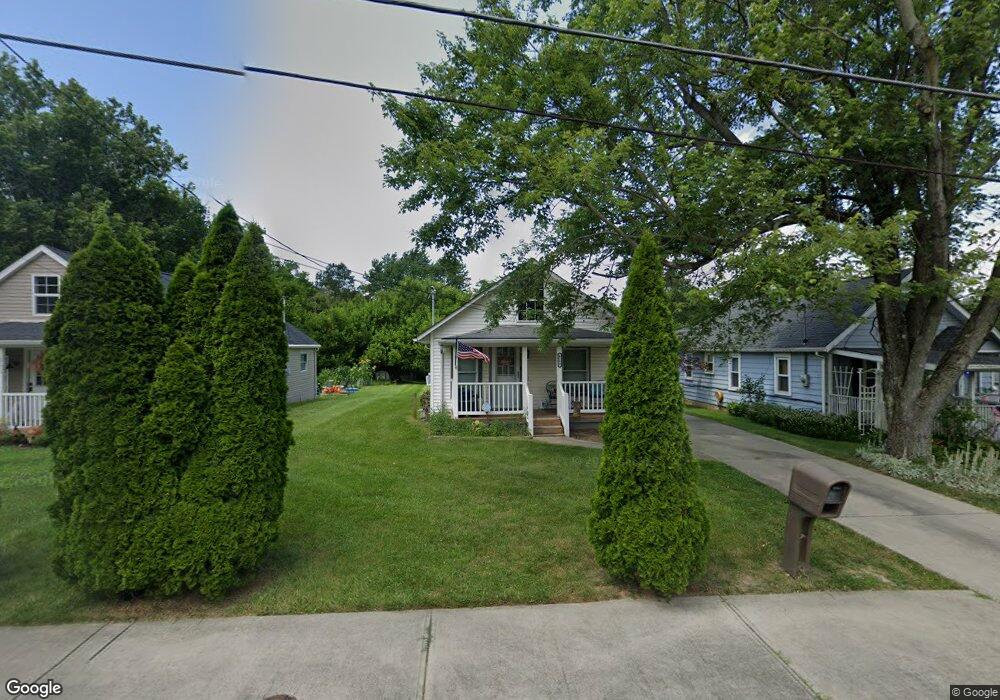
6783 Maple Dr Franklin, OH 45005
Estimated Value: $126,584 - $196,000
2
Beds
1
Bath
600
Sq Ft
$259/Sq Ft
Est. Value
About This Home
This home is located at 6783 Maple Dr, Franklin, OH 45005 and is currently estimated at $155,396, approximately $258 per square foot. 6783 Maple Dr is a home located in Warren County with nearby schools including Franklin High School.
Ownership History
Date
Name
Owned For
Owner Type
Purchase Details
Closed on
Nov 9, 2020
Sold by
Dorando Investments Llc
Bought by
Rudolph Haley
Current Estimated Value
Home Financials for this Owner
Home Financials are based on the most recent Mortgage that was taken out on this home.
Original Mortgage
$96,360
Outstanding Balance
$84,763
Interest Rate
2.8%
Mortgage Type
New Conventional
Estimated Equity
$70,633
Purchase Details
Closed on
Jul 22, 2020
Sold by
Ruppert Rachel M and Estate Of Arthur Hamblin Sr
Bought by
Dorando Investments Llc
Purchase Details
Closed on
Mar 6, 2008
Sold by
Watts Larry and Watts Virginia M
Bought by
Hamblin Arthur
Purchase Details
Closed on
Jan 30, 1992
Sold by
Purkey Thomas and Purkey Linda
Bought by
Watts and Watts Larry
Purchase Details
Closed on
Mar 22, 1984
Sold by
Blackford Blackford and Blackford Charles T
Bought by
Purkey Purkey and Purkey Thomas
Create a Home Valuation Report for This Property
The Home Valuation Report is an in-depth analysis detailing your home's value as well as a comparison with similar homes in the area
Home Values in the Area
Average Home Value in this Area
Purchase History
| Date | Buyer | Sale Price | Title Company |
|---|---|---|---|
| Rudolph Haley | $109,500 | Northwest Ttl Fam Of Compani | |
| Dorando Investments Llc | $20,000 | None Available | |
| Hamblin Arthur | -- | Attorney | |
| Watts | $17,000 | -- | |
| Purkey Purkey | $9,700 | -- |
Source: Public Records
Mortgage History
| Date | Status | Borrower | Loan Amount |
|---|---|---|---|
| Open | Rudolph Haley | $96,360 |
Source: Public Records
Tax History
| Year | Tax Paid | Tax Assessment Tax Assessment Total Assessment is a certain percentage of the fair market value that is determined by local assessors to be the total taxable value of land and additions on the property. | Land | Improvement |
|---|---|---|---|---|
| 2025 | $902 | $20,240 | $7,710 | $12,530 |
| 2024 | $902 | $20,240 | $7,710 | $12,530 |
| 2023 | $778 | $15,673 | $5,442 | $10,230 |
| 2022 | $759 | $15,673 | $5,443 | $10,231 |
| 2021 | $717 | $15,673 | $5,443 | $10,231 |
| 2020 | $736 | $13,871 | $4,816 | $9,055 |
| 2019 | $1,516 | $13,871 | $4,816 | $9,055 |
| 2018 | $656 | $13,871 | $4,816 | $9,055 |
| 2017 | $584 | $11,039 | $4,410 | $6,629 |
| 2016 | $596 | $11,039 | $4,410 | $6,629 |
| 2015 | $298 | $11,039 | $4,410 | $6,629 |
| 2014 | $579 | $10,420 | $4,160 | $6,250 |
| 2013 | $486 | $12,050 | $4,820 | $7,230 |
Source: Public Records
Map
Nearby Homes
- 1117 S Main St
- 5684 Olive Rd
- 6633 Rivulet Dr
- 6323 Shaker Rd
- 7189 Shaker Rd
- 5925 Millbrook Dr
- 100 Pleasant Hill Blvd
- 5865 Hayden Dr
- 0 Oxford Rd
- 5757 S Dixie Hwy
- 5013 Waterford Ln
- 5019 Waterford Dr
- 4822 Miller Rd
- 0 Kathy Ln Unit 1834240
- 0 Kathy Ln Unit 930066
- 1924 Tipperary Dr
- 25 Timber Creek Dr
- 65 Timber Creek Dr
- 5760 Autumn Dr
- 4964 Timberline Dr Unit 81
Your Personal Tour Guide
Ask me questions while you tour the home.