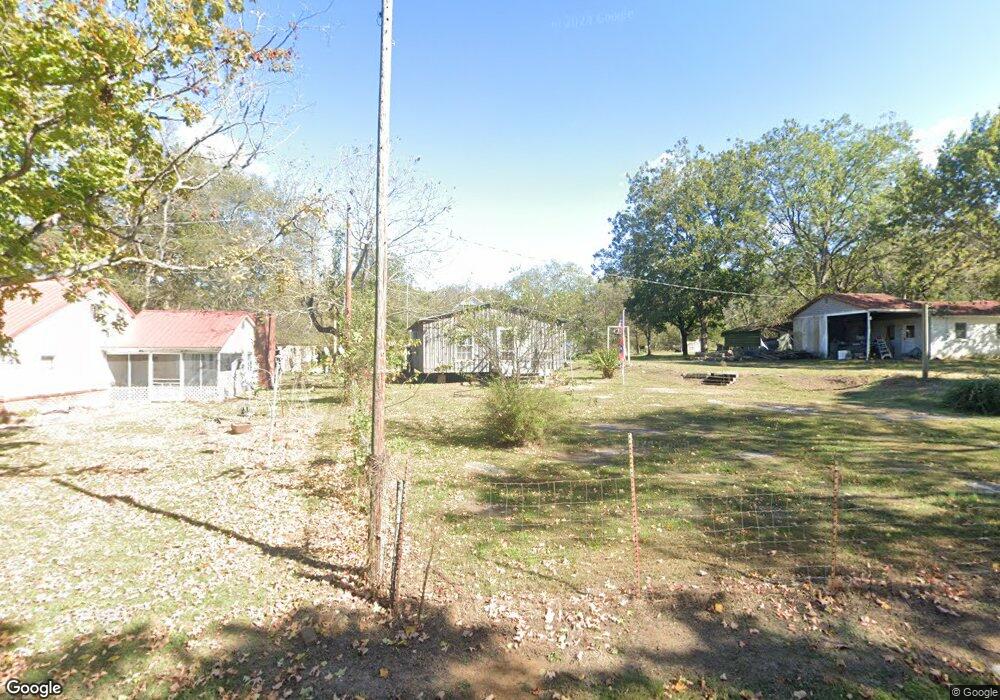
679 Himesville Rd Shelbyville, TN 37160
Estimated Value: $383,971 - $422,000
--
Bed
1
Bath
1,354
Sq Ft
$296/Sq Ft
Est. Value
About This Home
This home is located at 679 Himesville Rd, Shelbyville, TN 37160 and is currently estimated at $400,243, approximately $295 per square foot. 679 Himesville Rd is a home located in Bedford County with nearby schools including Liberty Elementary School.
Ownership History
Date
Name
Owned For
Owner Type
Purchase Details
Closed on
Aug 12, 2004
Sold by
Marshall Phillip A
Bought by
Nowlin Marshall William
Current Estimated Value
Home Financials for this Owner
Home Financials are based on the most recent Mortgage that was taken out on this home.
Original Mortgage
$5,000
Interest Rate
5.97%
Purchase Details
Closed on
Aug 15, 2003
Sold by
Marshall James R
Bought by
Marshall Phillip and Marshall Frances
Home Financials for this Owner
Home Financials are based on the most recent Mortgage that was taken out on this home.
Original Mortgage
$150,000
Interest Rate
3.99%
Purchase Details
Closed on
Jan 7, 1998
Bought by
Le Marshall Nowlin
Purchase Details
Closed on
Oct 9, 1997
Bought by
Le Marshall Nowlin
Purchase Details
Closed on
Jun 20, 1991
Bought by
Marshall Nowlin
Purchase Details
Closed on
Oct 20, 1951
Bought by
Philpot Andrew and Philpot Mary
Create a Home Valuation Report for This Property
The Home Valuation Report is an in-depth analysis detailing your home's value as well as a comparison with similar homes in the area
Home Values in the Area
Average Home Value in this Area
Purchase History
| Date | Buyer | Sale Price | Title Company |
|---|---|---|---|
| Nowlin Marshall William | $5,000 | -- | |
| Marshall Phillip | $126,000 | -- | |
| Le Marshall Nowlin | $47,500 | -- | |
| Le Marshall Nowlin | $47,500 | -- | |
| Marshall Nowlin | $95,100 | -- | |
| Philpot Andrew | -- | -- |
Source: Public Records
Mortgage History
| Date | Status | Borrower | Loan Amount |
|---|---|---|---|
| Closed | Philpot Andrew | $5,000 | |
| Previous Owner | Philpot Andrew | $150,000 |
Source: Public Records
Tax History Compared to Growth
Tax History
| Year | Tax Paid | Tax Assessment Tax Assessment Total Assessment is a certain percentage of the fair market value that is determined by local assessors to be the total taxable value of land and additions on the property. | Land | Improvement |
|---|---|---|---|---|
| 2025 | $1,072 | $46,100 | $0 | $0 |
| 2024 | $1,072 | $46,100 | $13,425 | $32,675 |
| 2023 | $1,072 | $46,100 | $13,425 | $32,675 |
| 2022 | $1,072 | $46,100 | $13,425 | $32,675 |
| 2021 | $906 | $46,100 | $13,425 | $32,675 |
| 2020 | $731 | $46,100 | $13,425 | $32,675 |
| 2019 | $731 | $27,475 | $11,275 | $16,200 |
| 2018 | $703 | $27,475 | $11,275 | $16,200 |
| 2017 | $703 | $27,475 | $11,275 | $16,200 |
| 2016 | $692 | $27,475 | $0 | $0 |
| 2015 | $692 | $27,475 | $0 | $0 |
| 2014 | $585 | $25,789 | $0 | $0 |
Source: Public Records
Map
Nearby Homes
- 495 Himesville Rd
- 455 Himesville Rd
- 209 Gladys Dr
- 0 Himesville Rd
- 176 Corder Ln
- 119 Crestland Cir
- 0 Highway 130 E
- 315 Woodland Dr
- 231 Riverbend Country Club Rd
- 1519 Highway 130 E
- 201 Sulphur Springs Rd
- 0 New Center Church Rd
- 128 Riverlake Rd
- 506 New Center Church Rd
- 1413 Highway 130 E
- 339 Riverbend Country Club Rd
- 602 Narrows Rd
- 485 Naron Rd
- 112 August Way
- 310 Crest Dr
- 650 Himesville Rd
- 668 Himesville Rd
- 1620 Highway 82 S
- 1604 Highway 82 S
- 155 Wallis Rd
- 101 Wills Valley Dr
- 1515 Highway 82 S
- 104 Wallis Rd
- 560 Himesville Rd
- 0 Carr Creek Unit 1877313
- 1510 Highway 82 S
- 1709 Highway 82 S
- 1435 Highway 82 S
- 1431 Highway 82 S
- 1713 Highway 82 S
- 678 Himesville Rd
- 566 Himesville Rd
- 126 Simmons Rd
- 320 New Hope Rd
- 1905 Highway 82 S