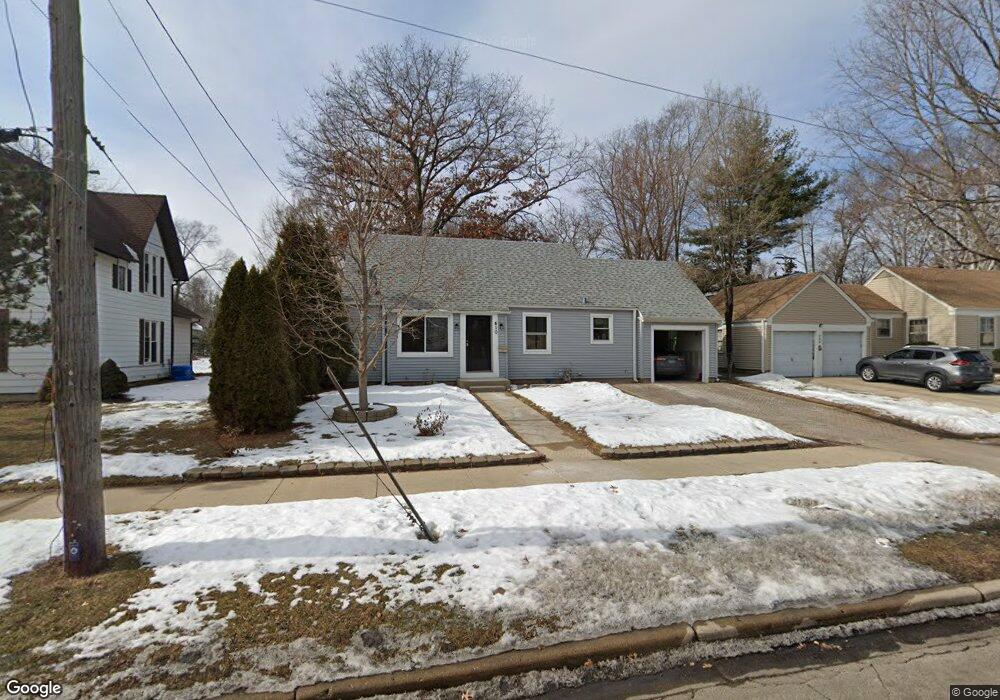
679 Sherman Ave Elgin, IL 60120
Southeast Elgin NeighborhoodEstimated Value: $223,000 - $279,885
4
Beds
2
Baths
1,452
Sq Ft
$180/Sq Ft
Est. Value
About This Home
This home is located at 679 Sherman Ave, Elgin, IL 60120 and is currently estimated at $260,721, approximately $179 per square foot. 679 Sherman Ave is a home located in Kane County with nearby schools including Huff Elementary School, Ellis Middle School, and Elgin High School.
Ownership History
Date
Name
Owned For
Owner Type
Purchase Details
Closed on
Apr 14, 2012
Sold by
Saldana Jose A and Saldana Stacy M
Bought by
Equity Trust Company and Gilberto Funes Ira
Current Estimated Value
Purchase Details
Closed on
Oct 28, 2007
Sold by
Funes Guadencio
Bought by
Saldana Jose A and Saldana Stacy M
Home Financials for this Owner
Home Financials are based on the most recent Mortgage that was taken out on this home.
Original Mortgage
$139,055
Interest Rate
6.45%
Mortgage Type
FHA
Purchase Details
Closed on
Aug 28, 1998
Sold by
Funes Gilberto J
Bought by
Saldana Stacy M and Funes Guadencio
Home Financials for this Owner
Home Financials are based on the most recent Mortgage that was taken out on this home.
Original Mortgage
$122,750
Interest Rate
7.02%
Mortgage Type
FHA
Create a Home Valuation Report for This Property
The Home Valuation Report is an in-depth analysis detailing your home's value as well as a comparison with similar homes in the area
Home Values in the Area
Average Home Value in this Area
Purchase History
| Date | Buyer | Sale Price | Title Company |
|---|---|---|---|
| Equity Trust Company | $50,000 | Lakeshore Title Agency | |
| Saldana Jose A | -- | Chicago Title Insurance Co | |
| Saldana Stacy M | $125,000 | -- |
Source: Public Records
Mortgage History
| Date | Status | Borrower | Loan Amount |
|---|---|---|---|
| Previous Owner | Saldana Jose A | $139,055 | |
| Previous Owner | Saldana Stacy M | $122,750 |
Source: Public Records
Tax History
| Year | Tax Paid | Tax Assessment Tax Assessment Total Assessment is a certain percentage of the fair market value that is determined by local assessors to be the total taxable value of land and additions on the property. | Land | Improvement |
|---|---|---|---|---|
| 2024 | $5,688 | $79,077 | $14,199 | $64,878 |
| 2023 | $5,408 | $71,440 | $12,828 | $58,612 |
| 2022 | $5,128 | $65,141 | $11,697 | $53,444 |
| 2021 | $4,898 | $60,902 | $10,936 | $49,966 |
| 2020 | $4,548 | $55,869 | $10,440 | $45,429 |
| 2019 | $4,410 | $53,219 | $9,945 | $43,274 |
| 2018 | $3,900 | $45,344 | $9,369 | $35,975 |
| 2017 | $3,792 | $42,866 | $8,857 | $34,009 |
| 2016 | $3,601 | $39,768 | $8,217 | $31,551 |
| 2015 | -- | $36,451 | $7,532 | $28,919 |
| 2014 | -- | $36,001 | $7,439 | $28,562 |
| 2013 | -- | $42,123 | $7,635 | $34,488 |
Source: Public Records
Map
Nearby Homes
- 689 Bent St
- 631 Bent St
- 457 Arlington Ave
- 513 Cookane Ave
- 450 Villa St
- 483 Barrett St
- 332-334 St Charles St
- 445 Lucile Ave
- 518 Raymond St
- 262 Bartlett Place
- 286 Villa St
- 277 Gifford Place
- 115 N Porter St
- 385 Woodview Cir Unit B
- 833 Forest Ave
- 330 Buckingham Cir Unit C
- 211 Prairie St
- 7 National St Unit 7
- 3 National St Unit 3
- 216 Prairie St
Your Personal Tour Guide
Ask me questions while you tour the home.