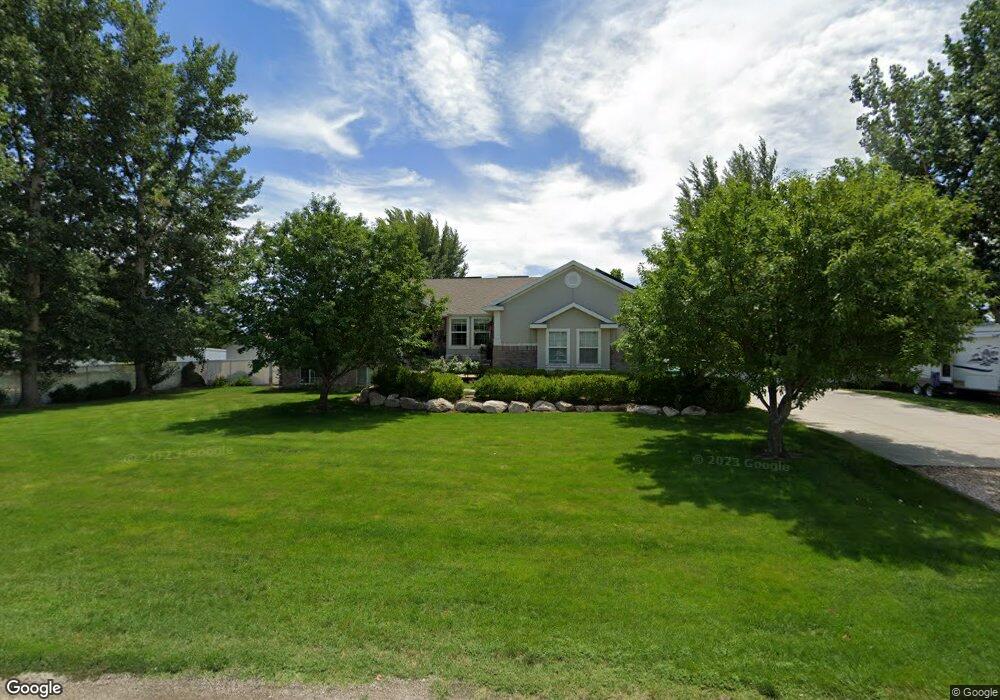
6791 W 4700 S Hooper, UT 84315
Estimated Value: $708,000 - $794,514
3
Beds
3
Baths
3,532
Sq Ft
$213/Sq Ft
Est. Value
About This Home
This home is located at 6791 W 4700 S, Hooper, UT 84315 and is currently estimated at $751,129, approximately $212 per square foot. 6791 W 4700 S is a home located in Weber County with nearby schools including Hooper Elementary School, Rocky Mountain Junior High School, and Fremont High School.
Ownership History
Date
Name
Owned For
Owner Type
Purchase Details
Closed on
Oct 23, 2000
Sold by
Royal Oak Homes Inc
Bought by
Peterson Trent B and Peterson Shannon P
Current Estimated Value
Home Financials for this Owner
Home Financials are based on the most recent Mortgage that was taken out on this home.
Original Mortgage
$198,550
Outstanding Balance
$72,254
Interest Rate
7.89%
Estimated Equity
$678,875
Purchase Details
Closed on
Nov 19, 1999
Sold by
Karras Allan and Miles Ralph
Bought by
Royal Oak Homes Inc
Home Financials for this Owner
Home Financials are based on the most recent Mortgage that was taken out on this home.
Original Mortgage
$146,250
Interest Rate
7.82%
Mortgage Type
Construction
Create a Home Valuation Report for This Property
The Home Valuation Report is an in-depth analysis detailing your home's value as well as a comparison with similar homes in the area
Home Values in the Area
Average Home Value in this Area
Purchase History
| Date | Buyer | Sale Price | Title Company |
|---|---|---|---|
| Peterson Trent B | -- | Bonneville Title | |
| Royal Oak Homes Inc | -- | Mountain View Title |
Source: Public Records
Mortgage History
| Date | Status | Borrower | Loan Amount |
|---|---|---|---|
| Open | Peterson Trent B | $198,550 | |
| Previous Owner | Royal Oak Homes Inc | $146,250 | |
| Closed | Royal Oak Homes Inc | $9,975 |
Source: Public Records
Tax History Compared to Growth
Tax History
| Year | Tax Paid | Tax Assessment Tax Assessment Total Assessment is a certain percentage of the fair market value that is determined by local assessors to be the total taxable value of land and additions on the property. | Land | Improvement |
|---|---|---|---|---|
| 2025 | $4,213 | $731,802 | $223,598 | $508,204 |
| 2024 | $4,054 | $395,969 | $124,598 | $271,371 |
| 2023 | $4,204 | $406,912 | $123,242 | $283,670 |
| 2022 | $4,099 | $404,800 | $105,755 | $299,045 |
| 2021 | $3,191 | $531,000 | $101,190 | $429,810 |
| 2020 | $3,254 | $496,000 | $81,800 | $414,200 |
| 2019 | $3,373 | $486,000 | $76,816 | $409,184 |
| 2018 | $3,360 | $463,000 | $76,816 | $386,184 |
| 2017 | $3,168 | $423,000 | $61,350 | $361,650 |
| 2016 | $2,724 | $196,844 | $34,350 | $162,494 |
| 2015 | $2,655 | $189,106 | $34,350 | $154,756 |
| 2014 | $2,455 | $170,101 | $34,350 | $135,751 |
Source: Public Records
Map
Nearby Homes
- 6036 W 4700 S
- 4100 S 5900 W
- 5319 S 7100 W
- 6014 W 5300 S
- 5947 W 4600 S
- 4146 S 5800 W Unit 5
- 4163 S 5800 W Unit 2
- 0 W 5500 S
- 5801 S 7100 W
- 3729 S 5600 W Unit 6
- 3720 S 5600 W Unit 2
- 3719 S 5600 W Unit 7
- 3706 S 5650 W Unit 9
- 5752 W 2425 N
- 3691 S 5600 W Unit 20
- 4111 S 5350 W
- 5478 W 3750 S
- 5335 W 5500 S
- 5389 W 3850 S Unit 22
- 5417 W 3850 S