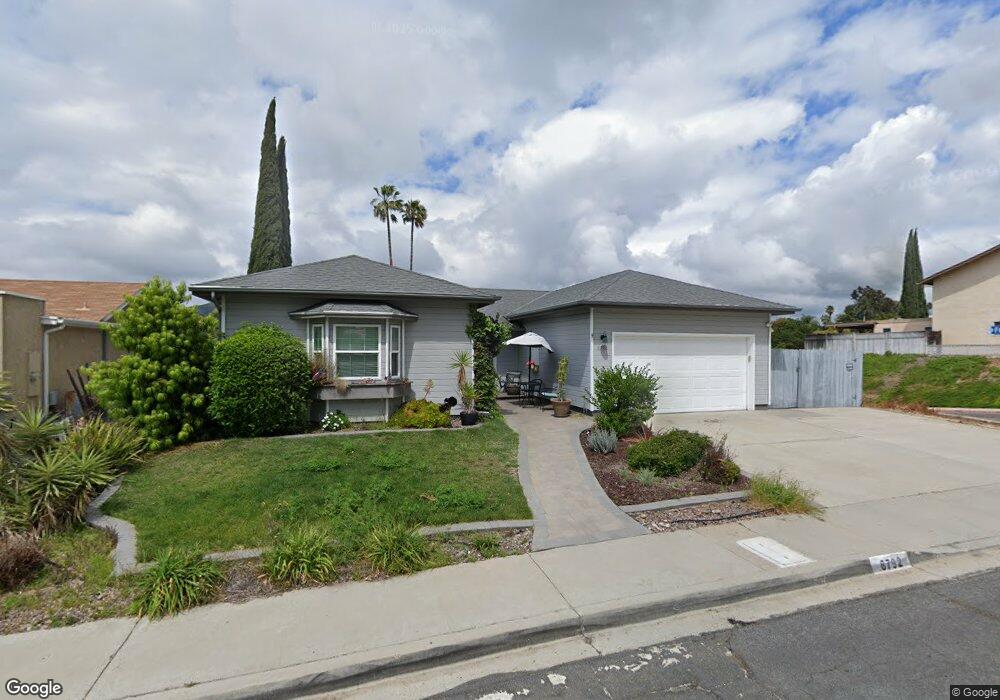
6792 Mewall Dr San Diego, CA 92119
Lake Murray NeighborhoodEstimated Value: $1,010,257 - $1,171,000
3
Beds
2
Baths
1,553
Sq Ft
$689/Sq Ft
Est. Value
About This Home
This home is located at 6792 Mewall Dr, San Diego, CA 92119 and is currently estimated at $1,069,564, approximately $688 per square foot. 6792 Mewall Dr is a home located in San Diego County with nearby schools including Gage Elementary School, Pershing Middle School, and Patrick Henry High School.
Ownership History
Date
Name
Owned For
Owner Type
Purchase Details
Closed on
Nov 6, 2018
Sold by
Weiss Charles and Decarlo Deann
Bought by
Weiss Charles Samuel and Decarlo Deaun Marie
Current Estimated Value
Purchase Details
Closed on
Oct 16, 2000
Sold by
Elizabeth A Sexton Donald L
Bought by
Garrett Henry E and Garrett Yvonne
Home Financials for this Owner
Home Financials are based on the most recent Mortgage that was taken out on this home.
Original Mortgage
$229,750
Outstanding Balance
$83,667
Interest Rate
7.9%
Estimated Equity
$985,897
Purchase Details
Closed on
Jul 13, 1995
Sold by
Petersen Dean Leonard and Petersen Jane Jansen
Bought by
Sexton Donald Lee and Blench Sexton Elizabeth Ann
Home Financials for this Owner
Home Financials are based on the most recent Mortgage that was taken out on this home.
Original Mortgage
$183,498
Interest Rate
7.63%
Mortgage Type
Assumption
Purchase Details
Closed on
Jul 21, 1988
Create a Home Valuation Report for This Property
The Home Valuation Report is an in-depth analysis detailing your home's value as well as a comparison with similar homes in the area
Home Values in the Area
Average Home Value in this Area
Purchase History
| Date | Buyer | Sale Price | Title Company |
|---|---|---|---|
| Weiss Charles Samuel | -- | None Available | |
| Garrett Henry E | $257,500 | Commonwealth Land Title Co | |
| Sexton Donald Lee | $180,000 | Commonwealth Land Title Co | |
| -- | $129,900 | -- |
Source: Public Records
Mortgage History
| Date | Status | Borrower | Loan Amount |
|---|---|---|---|
| Open | Garrett Henry E | $229,750 | |
| Previous Owner | Sexton Donald Lee | $183,498 |
Source: Public Records
Tax History Compared to Growth
Tax History
| Year | Tax Paid | Tax Assessment Tax Assessment Total Assessment is a certain percentage of the fair market value that is determined by local assessors to be the total taxable value of land and additions on the property. | Land | Improvement |
|---|---|---|---|---|
| 2025 | $7,030 | $578,615 | $202,754 | $375,861 |
| 2024 | $7,030 | $567,271 | $198,779 | $368,492 |
| 2023 | $6,896 | $556,149 | $194,882 | $361,267 |
| 2022 | $6,712 | $545,245 | $191,061 | $354,184 |
| 2021 | $6,663 | $534,555 | $187,315 | $347,240 |
| 2020 | $6,583 | $529,075 | $185,395 | $343,680 |
| 2019 | $6,464 | $518,702 | $181,760 | $336,942 |
| 2018 | $6,041 | $508,533 | $178,197 | $330,336 |
| 2017 | $80 | $498,562 | $174,703 | $323,859 |
| 2016 | $5,549 | $467,790 | $171,281 | $296,509 |
| 2015 | $5,360 | $451,900 | $168,709 | $283,191 |
| 2014 | $5,102 | $430,000 | $160,000 | $270,000 |
Source: Public Records
Map
Nearby Homes
- 8774 Tommy Dr
- 6802 Maury Dr
- 8735 Navajo Rd Unit 8
- 8711 Navajo Rd Unit 2
- 8715 Lake Murray Blvd Unit 4
- 8721 Lake Murray Blvd Unit 1
- 8765 Lake Murray Blvd Unit 3
- 2524 Seattle Dr
- 8671 Lake Murray Blvd Unit 4
- 8419 Hudson Dr
- 8649 Lake Murray Blvd Unit 4
- 7142 Bobhird Dr
- 9411 Lake Murray Blvd Unit B
- 8374 Lake Gaby Ave
- 8402 Boulder Place
- 8447 Harwell Dr
- 700 Wakefield Ct
- 8343 San Carlos Dr
- 7622 Rainswept Ln Unit 134
- 7620 Rainswept Ln Unit 135
- 6782 Mewall Dr
- 6772 Mewall Dr
- 6806 Mewall Dr
- 6785 Mewall Dr
- 6795 Mewall Dr
- 6775 Mewall Dr
- 6762 Mewall Dr
- 8797 Tommy Dr
- 6814 Mewall Dr
- 8904 Ferguson Way
- 6765 Mewall Dr
- 8789 Tommy Dr
- 8805 Tommy Ct
- 6752 Mewall Dr
- 8943 Ferguson Way
- 8912 Ferguson Way
- 6822 Mewall Dr
- 6755 Mewall Dr
- 8781 Tommy Dr
- 8815 Tommy Ct