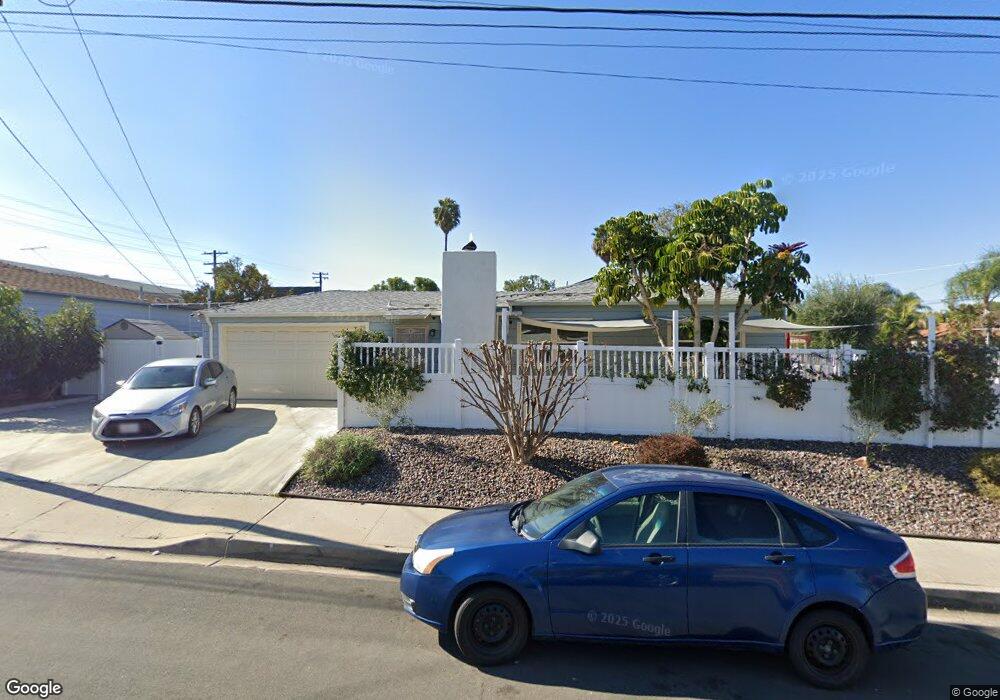
6793 Mohawk St San Diego, CA 92115
College East NeighborhoodEstimated Value: $813,000 - $940,538
3
Beds
2
Baths
1,448
Sq Ft
$621/Sq Ft
Est. Value
About This Home
This home is located at 6793 Mohawk St, San Diego, CA 92115 and is currently estimated at $898,885, approximately $620 per square foot. 6793 Mohawk St is a home located in San Diego County with nearby schools including Clay Elementary School, Mann Middle School, and Crawford High School.
Ownership History
Date
Name
Owned For
Owner Type
Purchase Details
Closed on
Mar 26, 2013
Sold by
Lent Tad
Bought by
Thai Ngoc Quang and Nguyen Quynh Mai Thi
Current Estimated Value
Home Financials for this Owner
Home Financials are based on the most recent Mortgage that was taken out on this home.
Original Mortgage
$324,000
Outstanding Balance
$68,519
Interest Rate
3.49%
Mortgage Type
New Conventional
Estimated Equity
$830,366
Purchase Details
Closed on
Sep 27, 2012
Sold by
Crook Tyler and Crook Monica Ma At
Bought by
Lent Tad
Purchase Details
Closed on
Jan 21, 2003
Sold by
Davidson Denise
Bought by
Crook Tyler and Crook Monica Maat
Home Financials for this Owner
Home Financials are based on the most recent Mortgage that was taken out on this home.
Original Mortgage
$231,900
Interest Rate
5.99%
Purchase Details
Closed on
May 1, 2000
Sold by
Leonard Francis & Madge Trust 05-02-96
Bought by
Leonard William F
Purchase Details
Closed on
May 2, 1996
Sold by
Leonard William F and Leonard Madge B
Bought by
Francis & Madge Leonard Trust
Create a Home Valuation Report for This Property
The Home Valuation Report is an in-depth analysis detailing your home's value as well as a comparison with similar homes in the area
Home Values in the Area
Average Home Value in this Area
Purchase History
| Date | Buyer | Sale Price | Title Company |
|---|---|---|---|
| Thai Ngoc Quang | $405,000 | Lawyers Title | |
| Lent Tad | -- | Lawyers Title | |
| Lent Tad | $230,000 | Lawyers Title | |
| Crook Tyler | $290,000 | First American Title | |
| Leonard William F | -- | -- | |
| Francis & Madge Leonard Trust | -- | -- |
Source: Public Records
Mortgage History
| Date | Status | Borrower | Loan Amount |
|---|---|---|---|
| Open | Thai Ngoc Quang | $324,000 | |
| Previous Owner | Crook Tyler | $231,900 | |
| Closed | Crook Tyler | $58,000 |
Source: Public Records
Tax History Compared to Growth
Tax History
| Year | Tax Paid | Tax Assessment Tax Assessment Total Assessment is a certain percentage of the fair market value that is determined by local assessors to be the total taxable value of land and additions on the property. | Land | Improvement |
|---|---|---|---|---|
| 2025 | $5,954 | $498,717 | $172,394 | $326,323 |
| 2024 | $5,954 | $488,939 | $169,014 | $319,925 |
| 2023 | $5,820 | $479,352 | $165,700 | $313,652 |
| 2022 | $5,664 | $469,953 | $162,451 | $307,502 |
| 2021 | $5,624 | $460,739 | $159,266 | $301,473 |
| 2020 | $5,555 | $456,015 | $157,633 | $298,382 |
| 2019 | $5,455 | $447,075 | $154,543 | $292,532 |
| 2018 | $5,099 | $438,310 | $151,513 | $286,797 |
| 2017 | $4,976 | $429,717 | $148,543 | $281,174 |
| 2016 | $4,895 | $421,292 | $145,631 | $275,661 |
| 2015 | $4,821 | $414,965 | $143,444 | $271,521 |
| 2014 | $4,744 | $406,838 | $140,635 | $266,203 |
Source: Public Records
Map
Nearby Homes
- 6765 Amherst St Unit C
- 6735 Amherst St Unit 1E
- 6615 Reservoir Ct
- 6927 Amherst St Unit 3
- 5091 Alumni Place
- 6650 Amherst St Unit 14A
- 7003 Saranac St Unit 203
- 6752 Solita Ave
- 4860 Rolando Ct Unit 52
- 4860 Rolando Ct Unit 29
- 4860 Rolando Ct Unit 81
- 4860 Rolando Ct Unit 25
- 4860 Rolando Ct Unit 37
- 6911 Alvarado Rd Unit 20
- 7105 Amherst St
- 6775 Alvarado Rd Unit 21
- 6775 Alvarado Rd Unit 26
- 6851 Alvarado Rd Unit 21
- 7127 Saranac St
- 6765 Alvarado Rd Unit 10
- 6781 Mohawk St
- 6781-85 Mohawk St
- 4966 68th St
- 6771 Mohawk St
- 6773 Mohawk St
- 6767 Mohawk St Unit 69
- 6792 Mohawk St
- 4975 68th St
- 4965 68th St
- 4967 68th St
- 6786 Mohawk St Unit 88
- 6776 Mohawk St Unit 78
- 4951-4959 4951-4959 68th St
- 6778 Mohawk St
- 4951-59 68th St
- 6761 Mohawk St Unit 63
- 6803 Mohawk St Unit 11
- 5028 68th St
- 6821 Mohawk St Unit 23
- 6768 Mohawk St Unit 70