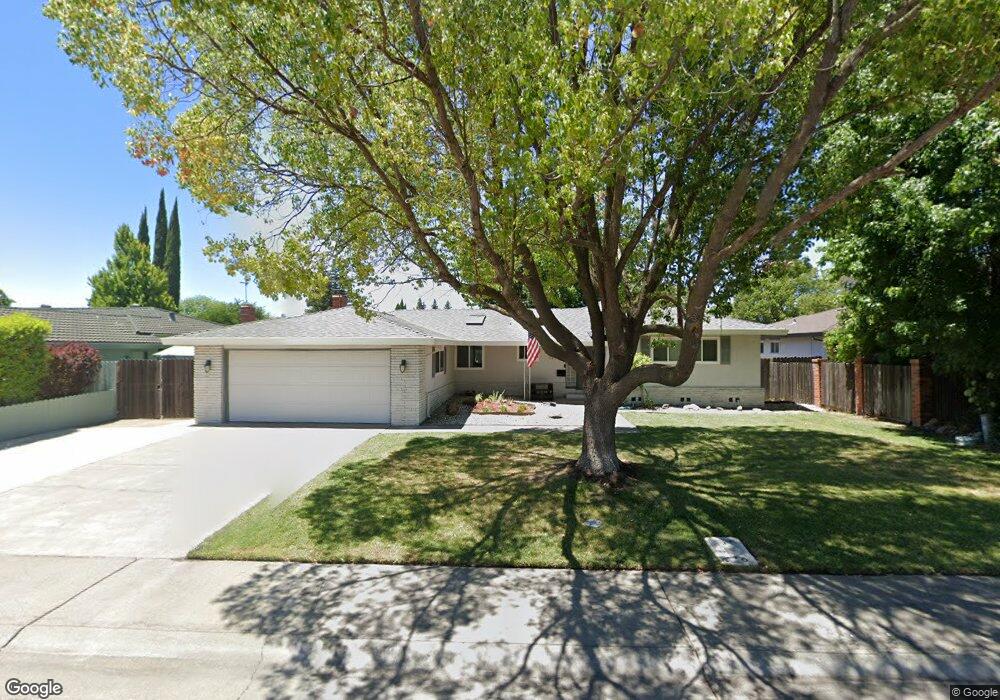
6796 Orleans Way Sacramento, CA 95831
Pocket-Greenhaven NeighborhoodEstimated Value: $604,413 - $671,000
3
Beds
2
Baths
1,737
Sq Ft
$369/Sq Ft
Est. Value
About This Home
This home is located at 6796 Orleans Way, Sacramento, CA 95831 and is currently estimated at $640,103, approximately $368 per square foot. 6796 Orleans Way is a home located in Sacramento County with nearby schools including Genevieve Didion School, Sam Brannan Middle School, and John F. Kennedy High School.
Ownership History
Date
Name
Owned For
Owner Type
Purchase Details
Closed on
Dec 2, 2021
Sold by
Lau Clifford
Bought by
Lau Clifford F and Lau Van Family Trust
Current Estimated Value
Purchase Details
Closed on
Jun 9, 2009
Sold by
Bannister Michael J and Bannister Hitomi Y
Bought by
Lau Clifford
Home Financials for this Owner
Home Financials are based on the most recent Mortgage that was taken out on this home.
Original Mortgage
$224,800
Outstanding Balance
$141,955
Interest Rate
4.76%
Mortgage Type
Purchase Money Mortgage
Estimated Equity
$498,148
Purchase Details
Closed on
Dec 19, 2000
Sold by
Lorraine F Radke 1996 Trust and Lorraine F
Bought by
Bannister Michael J and Bannister Hitomi Y
Home Financials for this Owner
Home Financials are based on the most recent Mortgage that was taken out on this home.
Original Mortgage
$203,000
Interest Rate
7.81%
Mortgage Type
VA
Purchase Details
Closed on
Sep 11, 1996
Sold by
Radke Lorraine F
Bought by
Radke Lorraine F and Lorraine F Radke 1996 Trust
Create a Home Valuation Report for This Property
The Home Valuation Report is an in-depth analysis detailing your home's value as well as a comparison with similar homes in the area
Home Values in the Area
Average Home Value in this Area
Purchase History
| Date | Buyer | Sale Price | Title Company |
|---|---|---|---|
| Lau Clifford F | -- | None Available | |
| Lau Clifford F | -- | None Available | |
| Lau Clifford | $281,000 | Chicago Title Company | |
| Bannister Michael J | $204,000 | Commonwealth Land Title Co | |
| Radke Lorraine F | -- | -- |
Source: Public Records
Mortgage History
| Date | Status | Borrower | Loan Amount |
|---|---|---|---|
| Open | Lau Clifford | $224,800 | |
| Previous Owner | Bannister Michael J | $203,000 |
Source: Public Records
Tax History Compared to Growth
Tax History
| Year | Tax Paid | Tax Assessment Tax Assessment Total Assessment is a certain percentage of the fair market value that is determined by local assessors to be the total taxable value of land and additions on the property. | Land | Improvement |
|---|---|---|---|---|
| 2025 | $4,496 | $361,842 | $128,767 | $233,075 |
| 2024 | $4,496 | $354,748 | $126,243 | $228,505 |
| 2023 | $4,385 | $347,793 | $123,768 | $224,025 |
| 2022 | $4,326 | $340,975 | $121,342 | $219,633 |
| 2021 | $4,120 | $334,290 | $118,963 | $215,327 |
| 2020 | $4,147 | $330,864 | $117,744 | $213,120 |
| 2019 | $4,060 | $324,378 | $115,436 | $208,942 |
| 2018 | $3,956 | $318,019 | $113,173 | $204,846 |
| 2017 | $3,899 | $311,784 | $110,954 | $200,830 |
| 2016 | $3,790 | $305,672 | $108,779 | $196,893 |
| 2015 | $3,731 | $301,082 | $107,146 | $193,936 |
| 2014 | $3,641 | $295,186 | $105,048 | $190,138 |
Source: Public Records
Map
Nearby Homes
- 0 Riverside Blvd
- 6980 Riverside Blvd
- 487 Twin River Way
- 7232 Bayview Way
- 26 Marina Grande Ct
- 10 Fleet Ct
- 7262 Harbor Light Way
- 14 Westlite Ct
- 763 La Contenta Way
- 792 Parklin Ave
- 6235 Allenport Way
- 462 de Mar Dr
- 22 Basil Ct
- 4 Bingham Cir
- 64 Moonlit Cir
- 37 Starlit Cir
- 4 Marina Blue Ct
- 4074 Southampton St
- 4057 Southampton St
- 3236 Boston Rd
- 6800 Orleans Way
- 6792 Orleans Way
- 6787 Pocket Rd
- 6801 Pocket Rd
- 6775 Pocket Rd
- 6788 Orleans Way
- 6804 Orleans Way
- 6797 Orleans Way
- 6801 Orleans Way
- 6793 Orleans Way
- 6761 Pocket Rd
- 6805 Pocket Rd
- 6784 Orleans Way
- 6805 Orleans Way
- 6789 Orleans Way
- 6757 Pocket Rd
- 6785 Langston Way
- 6781 Orleans Way
- 6780 Orleans Way
- 6789 Langston Way