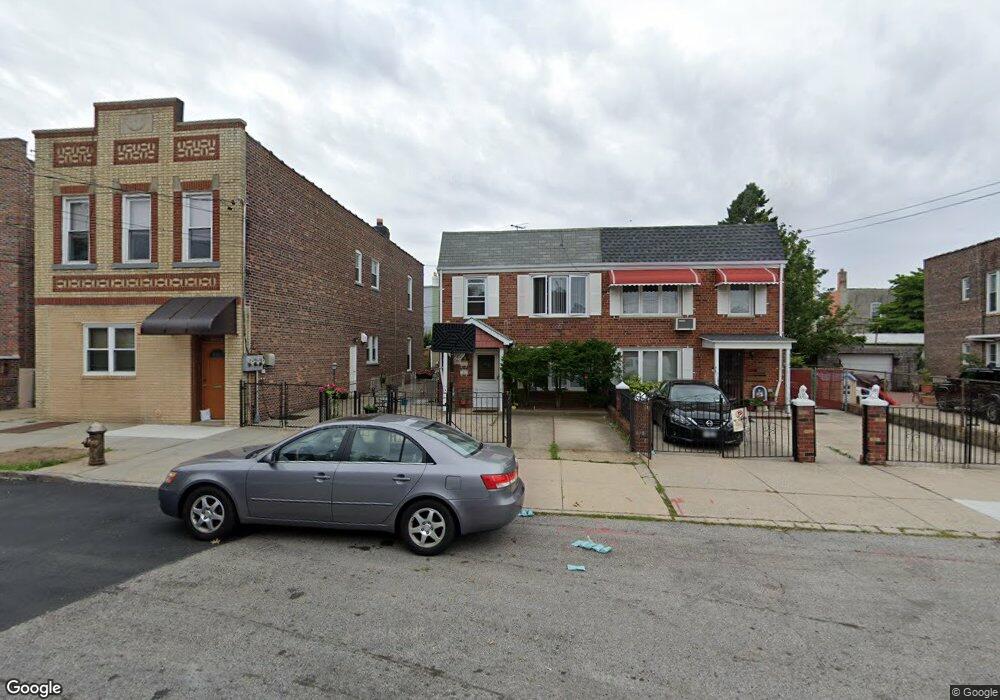
68-14 78th St Unit 1st FL Flushing, NY 11379
Middle Village NeighborhoodEstimated Value: $978,000 - $1,056,000
2
Beds
1
Bath
850
Sq Ft
$1,185/Sq Ft
Est. Value
About This Home
This home is located at 68-14 78th St Unit 1st FL, Flushing, NY 11379 and is currently estimated at $1,007,630, approximately $1,185 per square foot. 68-14 78th St Unit 1st FL is a home located in Queens County with nearby schools including P.S. 87 - Middle Village, Queens Metropolitan High School, and St. Margaret Catholic Academy.
Ownership History
Date
Name
Owned For
Owner Type
Purchase Details
Closed on
Jun 28, 2022
Sold by
Elmi Angelo
Bought by
Lin Ze Guang
Current Estimated Value
Home Financials for this Owner
Home Financials are based on the most recent Mortgage that was taken out on this home.
Original Mortgage
$500,000
Outstanding Balance
$475,693
Interest Rate
5.09%
Mortgage Type
Purchase Money Mortgage
Estimated Equity
$531,937
Purchase Details
Closed on
Jun 14, 2002
Sold by
Brzezinski Julia J and Brezinski Julia J
Bought by
Elmi Angelo
Home Financials for this Owner
Home Financials are based on the most recent Mortgage that was taken out on this home.
Original Mortgage
$200,000
Interest Rate
6.57%
Mortgage Type
Purchase Money Mortgage
Purchase Details
Closed on
May 31, 1997
Sold by
Brzezinski Julia J and Brezinski Julia J
Bought by
Brzezinski Julia J and Brezinski Julia J
Create a Home Valuation Report for This Property
The Home Valuation Report is an in-depth analysis detailing your home's value as well as a comparison with similar homes in the area
Home Values in the Area
Average Home Value in this Area
Purchase History
| Date | Buyer | Sale Price | Title Company |
|---|---|---|---|
| Lin Ze Guang | $900,000 | -- | |
| Lin Ze Guang | $900,000 | -- | |
| Elmi Angelo | -- | -- | |
| Elmi Angelo | -- | -- | |
| Brzezinski Julia J | -- | Advantage Title Agency | |
| Brzezinski Julia J | -- | Advantage Title Agency |
Source: Public Records
Mortgage History
| Date | Status | Borrower | Loan Amount |
|---|---|---|---|
| Open | Lin Ze Guang | $500,000 | |
| Closed | Lin Ze Guang | $500,000 | |
| Previous Owner | Elmi Angelo | $200,000 |
Source: Public Records
Tax History Compared to Growth
Tax History
| Year | Tax Paid | Tax Assessment Tax Assessment Total Assessment is a certain percentage of the fair market value that is determined by local assessors to be the total taxable value of land and additions on the property. | Land | Improvement |
|---|---|---|---|---|
| 2025 | $9,242 | $47,900 | $12,424 | $35,476 |
| 2024 | $9,242 | $46,013 | $12,861 | $33,152 |
| 2023 | $8,719 | $43,410 | $13,346 | $30,064 |
| 2022 | $7,889 | $52,740 | $16,620 | $36,120 |
| 2021 | $8,323 | $49,140 | $16,620 | $32,520 |
| 2020 | $8,153 | $48,240 | $16,620 | $31,620 |
| 2019 | $7,728 | $52,140 | $16,620 | $35,520 |
| 2018 | $7,077 | $36,175 | $12,913 | $23,262 |
| 2017 | $6,657 | $34,128 | $12,689 | $21,439 |
| 2016 | $6,513 | $34,128 | $12,689 | $21,439 |
| 2015 | $3,663 | $33,264 | $17,880 | $15,384 |
| 2014 | $3,663 | $31,954 | $17,236 | $14,718 |
Source: Public Records
Map
Nearby Homes
- 68-14 78th St
- 6814 78th St
- 6812 78th St
- 6820 78th St
- 68-20 78th St
- 68-20 78th St Unit 1
- 68-20 78th St Unit 2
- 68-20 78th St Unit 3
- 68-24 78th St
- 6824 78th St
- 6808 78th St
- 6826 78th St
- 6819 76th St
- 6817 76th St
- 6821 76th St
- 6815 76th St Unit 2
- 6815 76th St
- 6815 76th St Unit 1
- 6806 78th St
- 68-23 76th St