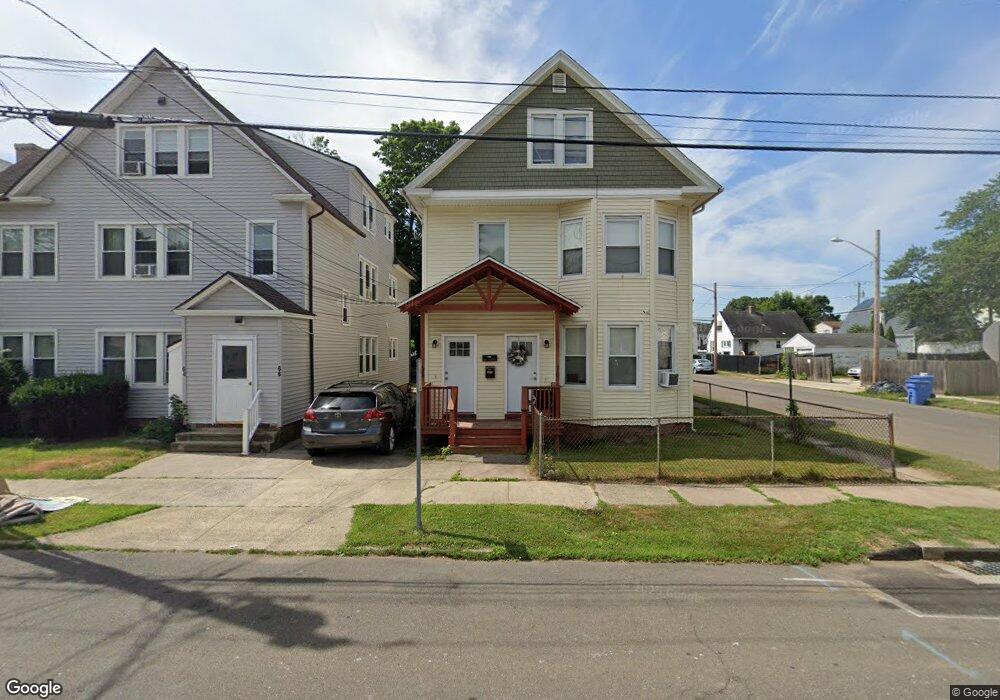
68 1st St Hamden, CT 06514
Estimated Value: $392,169 - $471,000
4
Beds
2
Baths
2,705
Sq Ft
$154/Sq Ft
Est. Value
About This Home
This home is located at 68 1st St, Hamden, CT 06514 and is currently estimated at $417,542, approximately $154 per square foot. 68 1st St is a home located in New Haven County with nearby schools including Church Street School, Hamden Middle School, and Hamden High School.
Ownership History
Date
Name
Owned For
Owner Type
Purchase Details
Closed on
Oct 12, 2012
Sold by
Regis Marjorie
Bought by
Hsbc Bank Usa Na
Current Estimated Value
Purchase Details
Closed on
Mar 25, 2010
Sold by
Regis Majorie L
Bought by
Regis Pierre
Purchase Details
Closed on
Jul 13, 2006
Sold by
Plante Jeneen M
Bought by
Regis Pierre and Regis Marjorie
Home Financials for this Owner
Home Financials are based on the most recent Mortgage that was taken out on this home.
Original Mortgage
$182,625
Interest Rate
6.71%
Purchase Details
Closed on
Oct 1, 2001
Sold by
Phoenix Prop Re Dev
Bought by
Plante Jeneen
Purchase Details
Closed on
Sep 7, 2000
Sold by
Gabucci Harold L and Gabucci Debra J
Bought by
Phoenix Prop Re Dev
Create a Home Valuation Report for This Property
The Home Valuation Report is an in-depth analysis detailing your home's value as well as a comparison with similar homes in the area
Home Values in the Area
Average Home Value in this Area
Purchase History
| Date | Buyer | Sale Price | Title Company |
|---|---|---|---|
| Hsbc Bank Usa Na | $243,500 | -- | |
| Regis Pierre | -- | -- | |
| Regis Pierre | $243,500 | -- | |
| Plante Jeneen | $164,900 | -- | |
| Phoenix Prop Re Dev | $75,000 | -- |
Source: Public Records
Mortgage History
| Date | Status | Borrower | Loan Amount |
|---|---|---|---|
| Open | Phoenix Prop Re Dev | $76,000 | |
| Previous Owner | Phoenix Prop Re Dev | $182,625 | |
| Previous Owner | Phoenix Prop Re Dev | $25,000 |
Source: Public Records
Tax History
| Year | Tax Paid | Tax Assessment Tax Assessment Total Assessment is a certain percentage of the fair market value that is determined by local assessors to be the total taxable value of land and additions on the property. | Land | Improvement |
|---|---|---|---|---|
| 2025 | $13,771 | $265,440 | $37,940 | $227,500 |
| 2024 | $9,852 | $177,170 | $24,150 | $153,020 |
| 2023 | $9,188 | $162,960 | $24,150 | $138,810 |
| 2022 | $9,041 | $162,960 | $24,150 | $138,810 |
| 2021 | $8,546 | $162,960 | $24,150 | $138,810 |
| 2020 | $6,822 | $131,250 | $26,810 | $104,440 |
| 2019 | $6,413 | $131,250 | $26,810 | $104,440 |
| 2018 | $6,295 | $131,250 | $26,810 | $104,440 |
| 2017 | $5,940 | $131,250 | $26,810 | $104,440 |
| 2016 | $5,954 | $131,250 | $26,810 | $104,440 |
| 2015 | $4,812 | $117,740 | $42,280 | $75,460 |
| 2014 | $4,701 | $117,740 | $42,280 | $75,460 |
Source: Public Records
Map
Nearby Homes
Your Personal Tour Guide
Ask me questions while you tour the home.