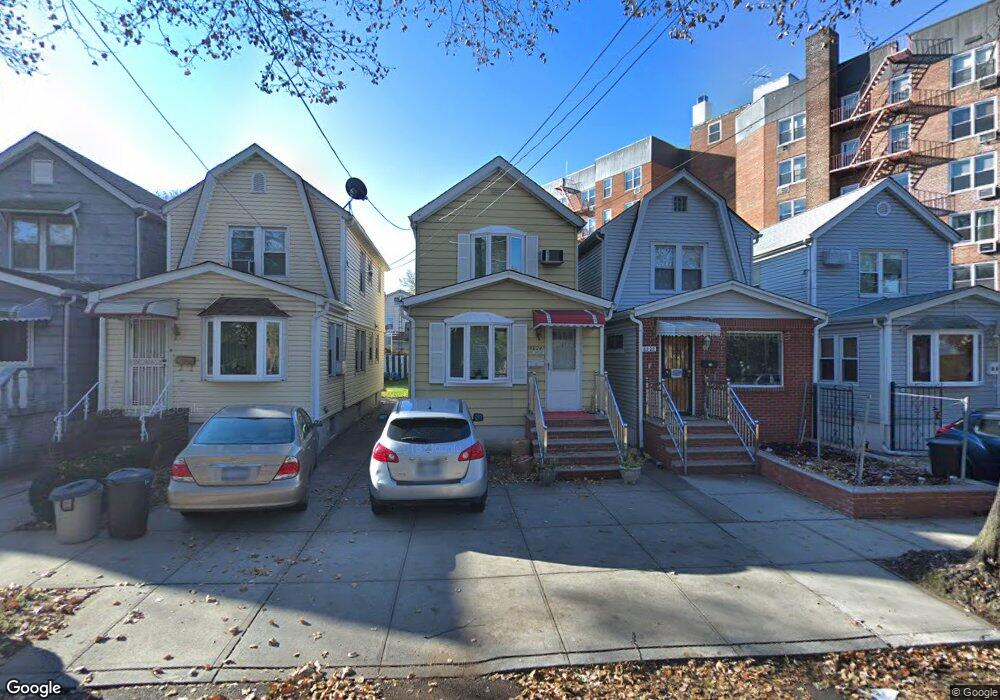
68-24 Nansen St Flushing, NY 11375
Forest Hills NeighborhoodEstimated Value: $725,826 - $1,077,000
--
Bed
2
Baths
930
Sq Ft
$937/Sq Ft
Est. Value
About This Home
This home is located at 68-24 Nansen St, Flushing, NY 11375 and is currently estimated at $871,457, approximately $937 per square foot. 68-24 Nansen St is a home located in Queens County with nearby schools including Ps 144 Col Jeromus Remsen, J.H.S. 190 Russell Sage, and Queens Metropolitan High School.
Ownership History
Date
Name
Owned For
Owner Type
Purchase Details
Closed on
Aug 18, 2008
Sold by
Bookedaire Corp
Bought by
Haberman Howard
Current Estimated Value
Home Financials for this Owner
Home Financials are based on the most recent Mortgage that was taken out on this home.
Original Mortgage
$79,943
Outstanding Balance
$52,674
Interest Rate
6.41%
Mortgage Type
Purchase Money Mortgage
Estimated Equity
$818,783
Purchase Details
Closed on
Aug 30, 2000
Sold by
Peluso Loretta and Brogna Loretta
Bought by
Yang Bing Hong and Yang Xiao Ming Kwok
Home Financials for this Owner
Home Financials are based on the most recent Mortgage that was taken out on this home.
Original Mortgage
$176,250
Outstanding Balance
$64,100
Interest Rate
8.07%
Estimated Equity
$807,357
Purchase Details
Closed on
Aug 28, 2000
Sold by
Savino Geraldine
Bought by
Brogna Loretta
Home Financials for this Owner
Home Financials are based on the most recent Mortgage that was taken out on this home.
Original Mortgage
$176,250
Outstanding Balance
$64,100
Interest Rate
8.07%
Estimated Equity
$807,357
Create a Home Valuation Report for This Property
The Home Valuation Report is an in-depth analysis detailing your home's value as well as a comparison with similar homes in the area
Home Values in the Area
Average Home Value in this Area
Purchase History
| Date | Buyer | Sale Price | Title Company |
|---|---|---|---|
| Haberman Howard | -- | -- | |
| Yang Bing Hong | $235,000 | Chicago Title | |
| Brogna Loretta | -- | Chicago Title |
Source: Public Records
Mortgage History
| Date | Status | Borrower | Loan Amount |
|---|---|---|---|
| Open | Haberman Howard | $79,943 | |
| Open | Yang Bing Hong | $176,250 |
Source: Public Records
Tax History Compared to Growth
Tax History
| Year | Tax Paid | Tax Assessment Tax Assessment Total Assessment is a certain percentage of the fair market value that is determined by local assessors to be the total taxable value of land and additions on the property. | Land | Improvement |
|---|---|---|---|---|
| 2025 | $2,561 | $34,039 | $7,364 | $26,675 |
| 2024 | $2,666 | $33,106 | $7,759 | $25,347 |
| 2023 | $2,389 | $31,385 | $6,923 | $24,462 |
| 2022 | $2,302 | $45,480 | $10,800 | $34,680 |
| 2021 | $2,326 | $47,820 | $10,800 | $37,020 |
| 2020 | $2,343 | $50,340 | $10,800 | $39,540 |
| 2019 | $2,227 | $43,740 | $10,800 | $32,940 |
| 2018 | $2,007 | $26,154 | $6,735 | $19,419 |
| 2017 | $1,874 | $24,721 | $8,090 | $16,631 |
| 2016 | $2,999 | $24,721 | $8,090 | $16,631 |
| 2015 | $2,593 | $23,638 | $9,570 | $14,068 |
| 2014 | $2,593 | $22,990 | $11,160 | $11,830 |
Source: Public Records
Map
Nearby Homes
- 68-15 Selfridge Stre 68-15 Selfridge St Unit 5G
- 68-15 Selfridge St Unit 5D
- 68-15 Selfridge St Unit 1J
- 68-20 Selfridge St Unit 6H
- 68-20 Selfridge St Unit 6J
- 68-40 Manse St
- 8831 69th Ave
- 90-01 68th Ave
- 6897 Alderton St
- 69-01 Alderton St
- 91-11 68th Ave
- 6828 Kessel St
- 68-09 Alderton St
- 7445 Yellowstone Blvd Unit 5G
- 7445 Yellowstone Blvd Unit 5C
- 7445 Yellowstone Blvd Unit 2A
- 74-45 Yellowstone Blvd Unit 1A
- 6915 Loubet St
- 7510 Yellowstone Blvd Unit 2C
- 68-37 Kessel St
- 6824 Nansen St
- 6826 Nansen St
- 6822 Nansen St
- 6828 Nansen St
- 6820 Nansen St
- 6830 Nansen St
- 68-30 Nansen St
- 68- 20 Nansen St
- 6832 Nansen St
- 6815 Selfridge St
- 6815 Selfridge St Unit 3E
- 6815 Selfridge St Unit 5H
- 6815 Selfridge St Unit 2J
- 6815 Selfridge St Unit 3F
- 6815 Selfridge St Unit L4
- 6815 Selfridge St Unit 6B
- 6815 Selfridge St Unit 1G
- 6815 Selfridge St Unit 1H
- 6815 Selfridge St Unit 1E
- 6815 Selfridge St Unit 2E