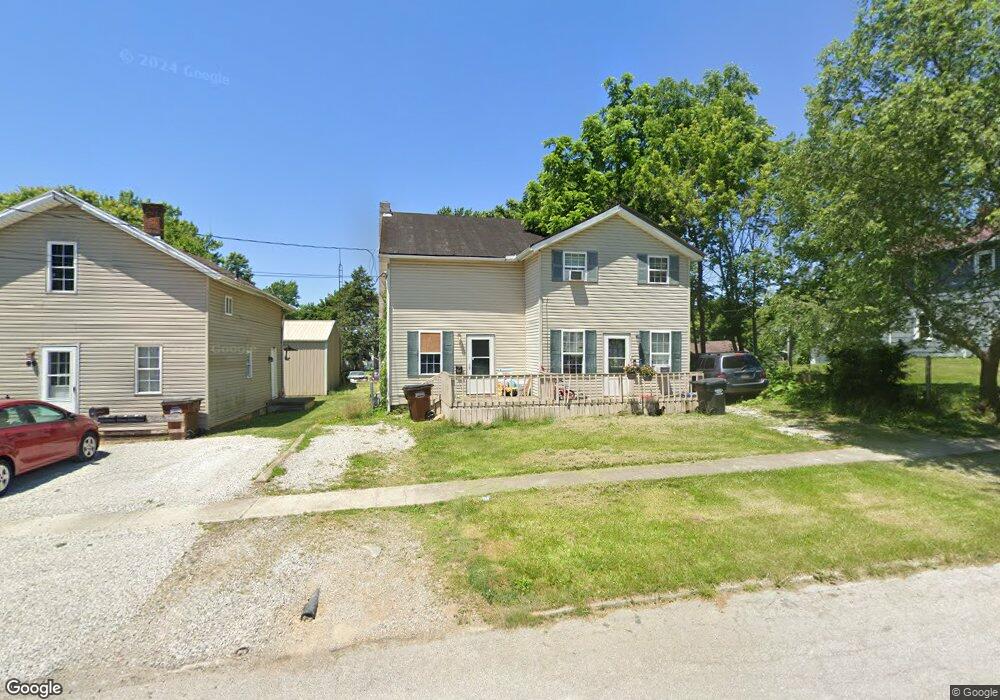
68 2nd St Shelby, OH 44875
Estimated Value: $57,000 - $114,000
3
Beds
2
Baths
1,784
Sq Ft
$48/Sq Ft
Est. Value
About This Home
This home is located at 68 2nd St, Shelby, OH 44875 and is currently estimated at $86,168, approximately $48 per square foot. 68 2nd St is a home located in Richland County with nearby schools including St. Mary's School.
Ownership History
Date
Name
Owned For
Owner Type
Purchase Details
Closed on
Oct 26, 2022
Sold by
Harmon Roger D
Bought by
Schroeder Carl E
Current Estimated Value
Purchase Details
Closed on
Mar 25, 2009
Sold by
Cit Group/Consumer Finance Inc
Bought by
Harmon Roger D
Purchase Details
Closed on
Dec 28, 2006
Sold by
Mabe Diana S
Bought by
Hoak Jason
Home Financials for this Owner
Home Financials are based on the most recent Mortgage that was taken out on this home.
Original Mortgage
$67,500
Interest Rate
10.1%
Mortgage Type
Purchase Money Mortgage
Purchase Details
Closed on
Jul 15, 2002
Sold by
Shasky Harold J
Bought by
Mabe Diana S
Home Financials for this Owner
Home Financials are based on the most recent Mortgage that was taken out on this home.
Original Mortgage
$35,500
Interest Rate
6.82%
Mortgage Type
New Conventional
Purchase Details
Closed on
May 8, 2002
Sold by
Jump Terry L
Bought by
Shasky Harold J Jean A
Home Financials for this Owner
Home Financials are based on the most recent Mortgage that was taken out on this home.
Original Mortgage
$35,500
Interest Rate
7.24%
Mortgage Type
New Conventional
Purchase Details
Closed on
Oct 25, 1993
Sold by
Miller Michael E
Bought by
Jump Terry L
Purchase Details
Closed on
Jan 8, 1990
Purchase Details
Closed on
Feb 1, 1986
Create a Home Valuation Report for This Property
The Home Valuation Report is an in-depth analysis detailing your home's value as well as a comparison with similar homes in the area
Home Values in the Area
Average Home Value in this Area
Purchase History
| Date | Buyer | Sale Price | Title Company |
|---|---|---|---|
| Schroeder Carl E | $24,500 | Barrister Title Group | |
| Harmon Roger D | $21,400 | Contract Processing & Title | |
| Hoak Jason | $75,000 | Marketable Title | |
| Mabe Diana S | $35,500 | -- | |
| Shasky Harold J Jean A | $35,000 | -- | |
| Jump Terry L | -- | -- | |
| -- | $35,000 | -- | |
| -- | $9,500 | -- |
Source: Public Records
Mortgage History
| Date | Status | Borrower | Loan Amount |
|---|---|---|---|
| Previous Owner | Hoak Jason | $67,500 | |
| Previous Owner | Mabe Diana S | $35,500 | |
| Previous Owner | Shasky Harold J Jean A | $35,500 |
Source: Public Records
Tax History
| Year | Tax Paid | Tax Assessment Tax Assessment Total Assessment is a certain percentage of the fair market value that is determined by local assessors to be the total taxable value of land and additions on the property. | Land | Improvement |
|---|---|---|---|---|
| 2024 | $337 | $8,600 | $4,490 | $4,110 |
| 2023 | $337 | $8,600 | $4,490 | $4,110 |
| 2022 | $1,130 | $22,420 | $4,250 | $18,170 |
| 2021 | $982 | $22,420 | $4,250 | $18,170 |
| 2020 | $983 | $22,420 | $4,250 | $18,170 |
| 2019 | $908 | $19,000 | $3,610 | $15,390 |
| 2018 | $900 | $19,000 | $3,610 | $15,390 |
| 2017 | $891 | $19,000 | $3,610 | $15,390 |
| 2016 | $923 | $19,790 | $3,430 | $16,360 |
| 2015 | $918 | $19,790 | $3,430 | $16,360 |
| 2014 | $887 | $19,790 | $3,430 | $16,360 |
| 2012 | $437 | $19,790 | $3,610 | $16,180 |
Source: Public Records
Map
Nearby Homes
Your Personal Tour Guide
Ask me questions while you tour the home.