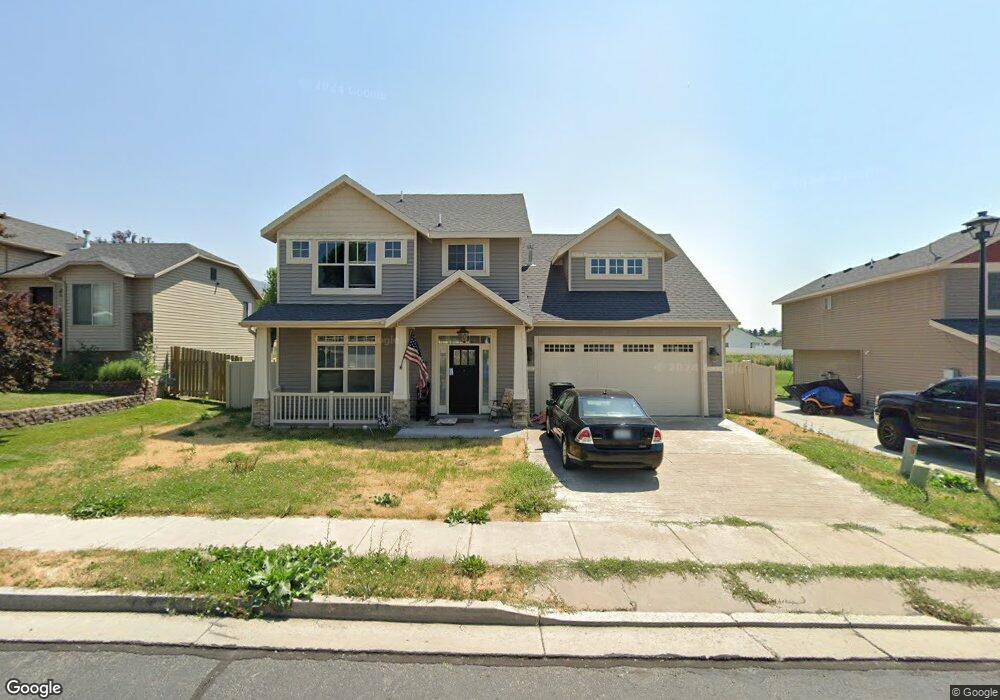
68 Andrews Ln Providence, UT 84332
Estimated Value: $466,000 - $602,000
3
Beds
3
Baths
2,210
Sq Ft
$243/Sq Ft
Est. Value
About This Home
This home is located at 68 Andrews Ln, Providence, UT 84332 and is currently estimated at $537,934, approximately $243 per square foot. 68 Andrews Ln is a home located in Cache County with nearby schools including Providence School, Spring Creek Middle School, and South Cache Middle School.
Ownership History
Date
Name
Owned For
Owner Type
Purchase Details
Closed on
Jan 29, 2024
Sold by
Mcdonald Maureen J
Bought by
Banded Properties Llc
Current Estimated Value
Purchase Details
Closed on
Sep 10, 2008
Sold by
Parkinson Erin
Bought by
Mcdonald Maureen J
Home Financials for this Owner
Home Financials are based on the most recent Mortgage that was taken out on this home.
Original Mortgage
$145,000
Interest Rate
6.5%
Mortgage Type
New Conventional
Purchase Details
Closed on
Aug 8, 2007
Sold by
H F Development Inc
Bought by
Parkinson Erin
Home Financials for this Owner
Home Financials are based on the most recent Mortgage that was taken out on this home.
Original Mortgage
$201,600
Interest Rate
6.65%
Mortgage Type
Construction
Create a Home Valuation Report for This Property
The Home Valuation Report is an in-depth analysis detailing your home's value as well as a comparison with similar homes in the area
Home Values in the Area
Average Home Value in this Area
Purchase History
| Date | Buyer | Sale Price | Title Company |
|---|---|---|---|
| Banded Properties Llc | -- | Real Advantage Title | |
| Mcdonald Maureen J | -- | Cache Title Company | |
| Parkinson Erin | -- | Northern Title Company |
Source: Public Records
Mortgage History
| Date | Status | Borrower | Loan Amount |
|---|---|---|---|
| Previous Owner | Mcdonald Maureen J | $145,000 | |
| Previous Owner | Parkinson Erin | $201,600 |
Source: Public Records
Tax History
| Year | Tax Paid | Tax Assessment Tax Assessment Total Assessment is a certain percentage of the fair market value that is determined by local assessors to be the total taxable value of land and additions on the property. | Land | Improvement |
|---|---|---|---|---|
| 2025 | $2,169 | $304,085 | $0 | $0 |
| 2024 | $2,338 | $305,000 | $0 | $0 |
| 2023 | $2,464 | $302,775 | $0 | $0 |
| 2022 | $2,230 | $258,775 | $0 | $0 |
| 2021 | $190 | $337,381 | $55,000 | $282,381 |
| 2020 | $1,822 | $300,549 | $55,000 | $245,549 |
| 2019 | $1,925 | $300,548 | $55,000 | $245,548 |
| 2018 | $1,720 | $274,240 | $55,000 | $219,240 |
| 2017 | $1,654 | $139,590 | $0 | $0 |
| 2016 | $1,672 | $119,895 | $0 | $0 |
| 2015 | $1,440 | $119,895 | $0 | $0 |
| 2014 | $1,405 | $119,895 | $0 | $0 |
| 2013 | -- | $119,895 | $0 | $0 |
Source: Public Records
Map
Nearby Homes
Your Personal Tour Guide
Ask me questions while you tour the home.