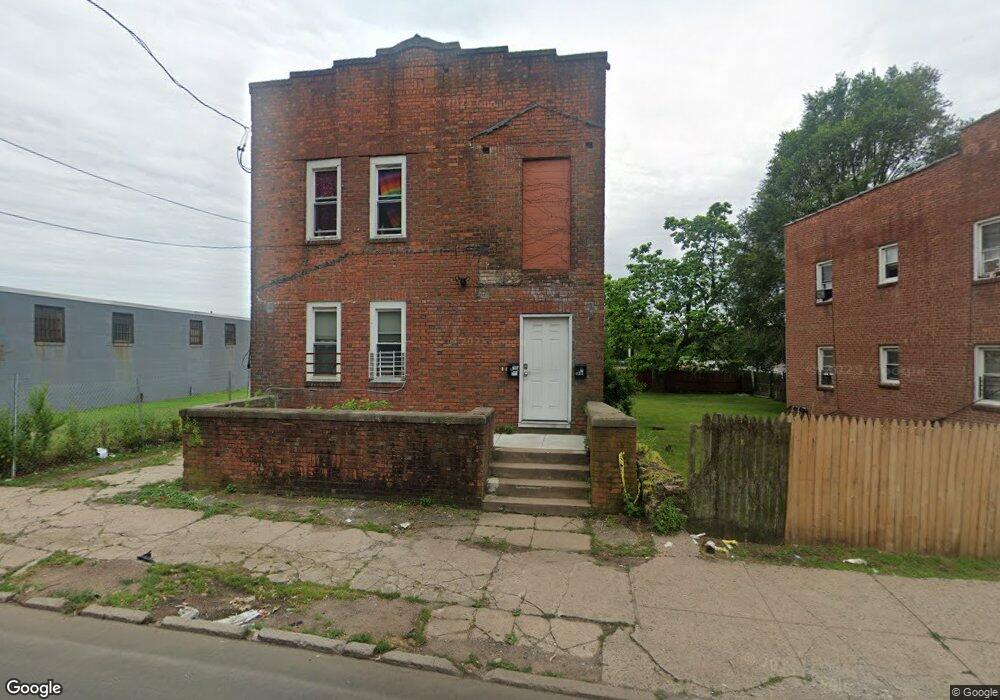
68 Barclay St New Haven, CT 06519
The Hill NeighborhoodEstimated Value: $243,083 - $326,000
2
Beds
2
Baths
2,010
Sq Ft
$147/Sq Ft
Est. Value
About This Home
This home is located at 68 Barclay St, New Haven, CT 06519 and is currently estimated at $296,021, approximately $147 per square foot. 68 Barclay St is a home located in New Haven County with nearby schools including Truman School.
Ownership History
Date
Name
Owned For
Owner Type
Purchase Details
Closed on
Sep 16, 2020
Sold by
S & E Investments 2 Llc
Bought by
Msa Investments 3 Llc
Current Estimated Value
Home Financials for this Owner
Home Financials are based on the most recent Mortgage that was taken out on this home.
Original Mortgage
$157,500
Outstanding Balance
$139,135
Interest Rate
2.9%
Mortgage Type
New Conventional
Estimated Equity
$156,887
Purchase Details
Closed on
Aug 31, 2018
Sold by
Gonzalez Omar
Bought by
S & E Investments 2 Llc
Purchase Details
Closed on
Jul 25, 1984
Bought by
Guarino Lena
Create a Home Valuation Report for This Property
The Home Valuation Report is an in-depth analysis detailing your home's value as well as a comparison with similar homes in the area
Home Values in the Area
Average Home Value in this Area
Purchase History
| Date | Buyer | Sale Price | Title Company |
|---|---|---|---|
| Msa Investments 3 Llc | -- | None Available | |
| Msa Investments 3 Llc | -- | None Available | |
| Msa Investments 3 Llc | -- | None Available | |
| S & E Investments 2 Llc | -- | -- | |
| Gonzalez Omar | $46,000 | -- | |
| Gonzalez Omar | $46,000 | -- | |
| Guarino Lena | -- | -- |
Source: Public Records
Mortgage History
| Date | Status | Borrower | Loan Amount |
|---|---|---|---|
| Open | Msa Investments 3 Llc | $157,500 | |
| Closed | Msa Investments 3 Llc | $157,500 |
Source: Public Records
Tax History
| Year | Tax Paid | Tax Assessment Tax Assessment Total Assessment is a certain percentage of the fair market value that is determined by local assessors to be the total taxable value of land and additions on the property. | Land | Improvement |
|---|---|---|---|---|
| 2025 | $4,724 | $119,910 | $17,570 | $102,340 |
| 2024 | $4,617 | $119,910 | $17,570 | $102,340 |
| 2023 | $4,461 | $119,910 | $17,570 | $102,340 |
| 2022 | $4,766 | $119,910 | $17,570 | $102,340 |
| 2021 | $2,943 | $67,060 | $15,120 | $51,940 |
| 2020 | $2,943 | $67,060 | $15,120 | $51,940 |
| 2019 | $2,455 | $57,120 | $15,120 | $42,000 |
| 2018 | $2,455 | $57,120 | $15,120 | $42,000 |
| 2017 | $2,226 | $57,540 | $15,120 | $42,420 |
| 2016 | $1,914 | $46,060 | $10,220 | $35,840 |
| 2015 | $1,914 | $46,060 | $10,220 | $35,840 |
| 2014 | $1,914 | $46,060 | $10,220 | $35,840 |
Source: Public Records
Map
Nearby Homes