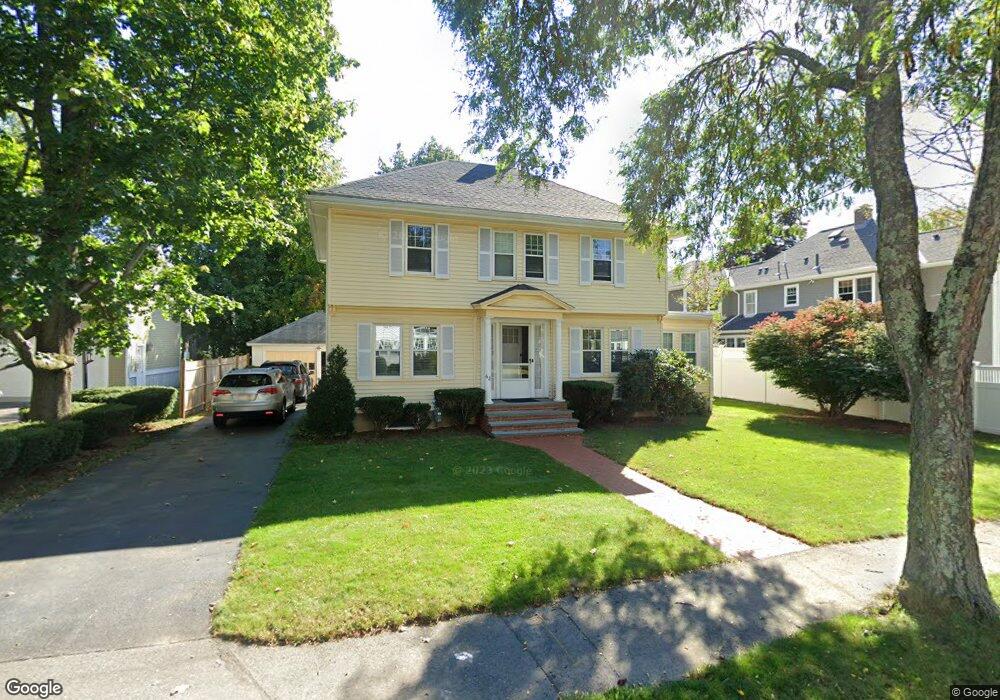
68 Bradford St Needham, MA 02492
Estimated Value: $1,296,000 - $1,535,508
4
Beds
2
Baths
942
Sq Ft
$1,494/Sq Ft
Est. Value
About This Home
This home is located at 68 Bradford St, Needham, MA 02492 and is currently estimated at $1,407,127, approximately $1,493 per square foot. 68 Bradford St is a home located in Norfolk County with nearby schools including Broadmeadow Elementary School, High Rock Middle School, and Pollard Middle School.
Ownership History
Date
Name
Owned For
Owner Type
Purchase Details
Closed on
Apr 29, 1987
Sold by
Lavelle Philip B
Bought by
Sumner Scott H
Current Estimated Value
Home Financials for this Owner
Home Financials are based on the most recent Mortgage that was taken out on this home.
Original Mortgage
$110,000
Interest Rate
8.99%
Mortgage Type
Purchase Money Mortgage
Create a Home Valuation Report for This Property
The Home Valuation Report is an in-depth analysis detailing your home's value as well as a comparison with similar homes in the area
Home Values in the Area
Average Home Value in this Area
Purchase History
| Date | Buyer | Sale Price | Title Company |
|---|---|---|---|
| Sumner Scott H | $262,000 | -- |
Source: Public Records
Mortgage History
| Date | Status | Borrower | Loan Amount |
|---|---|---|---|
| Open | Sumner Scott H | $175,500 | |
| Closed | Sumner Scott H | $220,000 | |
| Closed | Sumner Scott H | $108,000 | |
| Closed | Sumner Scott H | $110,000 |
Source: Public Records
Tax History Compared to Growth
Tax History
| Year | Tax Paid | Tax Assessment Tax Assessment Total Assessment is a certain percentage of the fair market value that is determined by local assessors to be the total taxable value of land and additions on the property. | Land | Improvement |
|---|---|---|---|---|
| 2025 | $12,002 | $1,132,300 | $910,300 | $222,000 |
| 2024 | $10,261 | $819,600 | $587,300 | $232,300 |
| 2023 | $10,432 | $800,000 | $587,300 | $212,700 |
| 2022 | $9,937 | $743,200 | $538,900 | $204,300 |
| 2021 | $9,684 | $743,200 | $538,900 | $204,300 |
| 2020 | $9,285 | $743,400 | $541,200 | $202,200 |
| 2019 | $8,542 | $689,400 | $492,000 | $197,400 |
| 2018 | $8,190 | $689,400 | $492,000 | $197,400 |
| 2017 | $7,941 | $667,900 | $492,000 | $175,900 |
| 2016 | $8,178 | $708,700 | $492,000 | $216,700 |
| 2015 | $8,001 | $708,700 | $492,000 | $216,700 |
| 2014 | $7,887 | $677,600 | $467,200 | $210,400 |
Source: Public Records
Map
Nearby Homes
- 26 Pinewood Rd
- 42 Otis St Unit R
- 40 Otis St Unit L
- 154 Warren St
- 233 Warren St
- 1011 Webster St
- 71 School St
- 62 Washington Ave
- 8 Wilshire Park
- 193 Garden St
- 190 Brookline St
- 556 Webster St
- 247 Broad Meadow Rd
- 332 Hillcrest Rd
- 47 Emerson Rd
- 120 Wildwood Dr
- 30 Richardson Dr
- 287 High Rock St
- 178 South St
- 100 Rosemary Way Unit 129