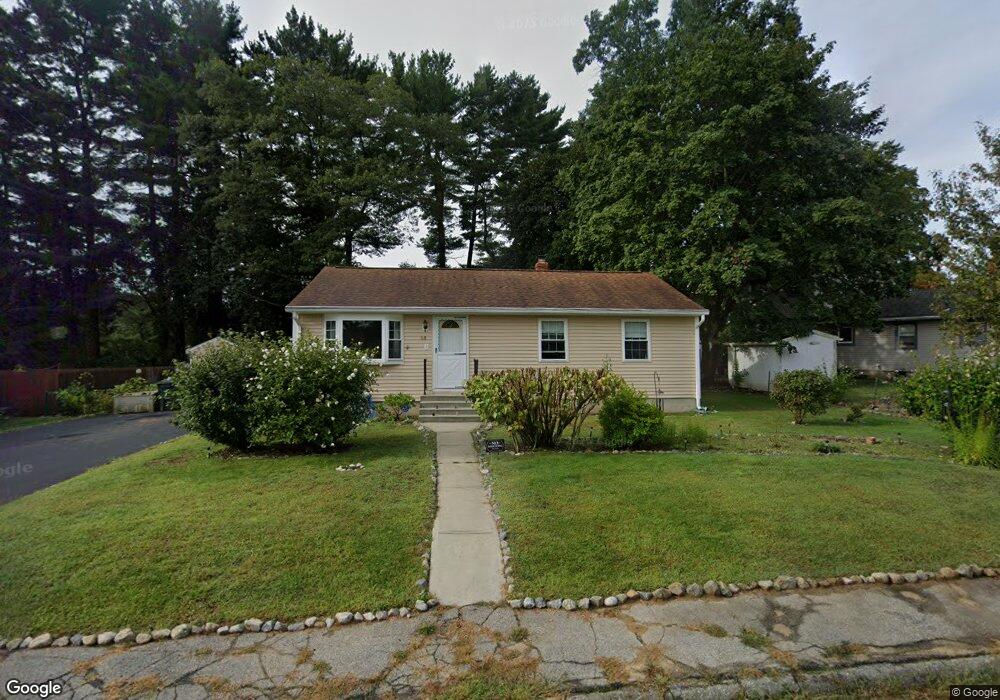
68 Cedar St Coventry, RI 02816
Estimated Value: $336,616 - $389,000
3
Beds
1
Bath
912
Sq Ft
$399/Sq Ft
Est. Value
About This Home
This home is located at 68 Cedar St, Coventry, RI 02816 and is currently estimated at $364,154, approximately $399 per square foot. 68 Cedar St is a home located in Kent County with nearby schools including Alan Shawn Feinstein Ms Of Cov, Coventry High School, and St Joseph School.
Ownership History
Date
Name
Owned For
Owner Type
Purchase Details
Closed on
Aug 20, 2025
Sold by
Daggett Robin L
Bought by
Robin L Daggett T L and Robin Daggett
Current Estimated Value
Purchase Details
Closed on
Dec 21, 2022
Sold by
Watters Ronald L and Daggett Robin L
Bought by
Daggett Robin L
Purchase Details
Closed on
Oct 1, 2012
Sold by
Watters Barton L
Bought by
Daggett Robin L and Watters Sandra L
Create a Home Valuation Report for This Property
The Home Valuation Report is an in-depth analysis detailing your home's value as well as a comparison with similar homes in the area
Purchase History
| Date | Buyer | Sale Price | Title Company |
|---|---|---|---|
| Robin L Daggett T L | -- | -- | |
| Robin L Daggett T L | -- | -- | |
| Daggett Robin L | $85,000 | None Available | |
| Daggett Robin L | $85,000 | None Available | |
| Daggett Robin L | -- | -- | |
| Daggett Robin L | -- | -- |
Source: Public Records
Tax History
| Year | Tax Paid | Tax Assessment Tax Assessment Total Assessment is a certain percentage of the fair market value that is determined by local assessors to be the total taxable value of land and additions on the property. | Land | Improvement |
|---|---|---|---|---|
| 2025 | $3,678 | $228,600 | $80,700 | $147,900 |
| 2024 | $3,626 | $228,900 | $81,000 | $147,900 |
| 2023 | $3,509 | $228,900 | $81,000 | $147,900 |
| 2022 | $3,572 | $182,500 | $79,200 | $103,300 |
| 2021 | $3,541 | $182,500 | $79,200 | $103,300 |
| 2020 | $4,059 | $182,500 | $79,200 | $103,300 |
| 2019 | $3,138 | $141,100 | $60,300 | $80,800 |
| 2018 | $3,049 | $141,100 | $60,300 | $80,800 |
| 2017 | $2,960 | $141,100 | $60,300 | $80,800 |
| 2016 | $2,809 | $131,200 | $59,300 | $71,900 |
| 2015 | $2,733 | $131,200 | $59,300 | $71,900 |
| 2014 | $1,497 | $131,200 | $59,300 | $71,900 |
| 2013 | $2,930 | $157,000 | $72,800 | $84,200 |
Source: Public Records
Map
Nearby Homes
Your Personal Tour Guide
Ask me questions while you tour the home.