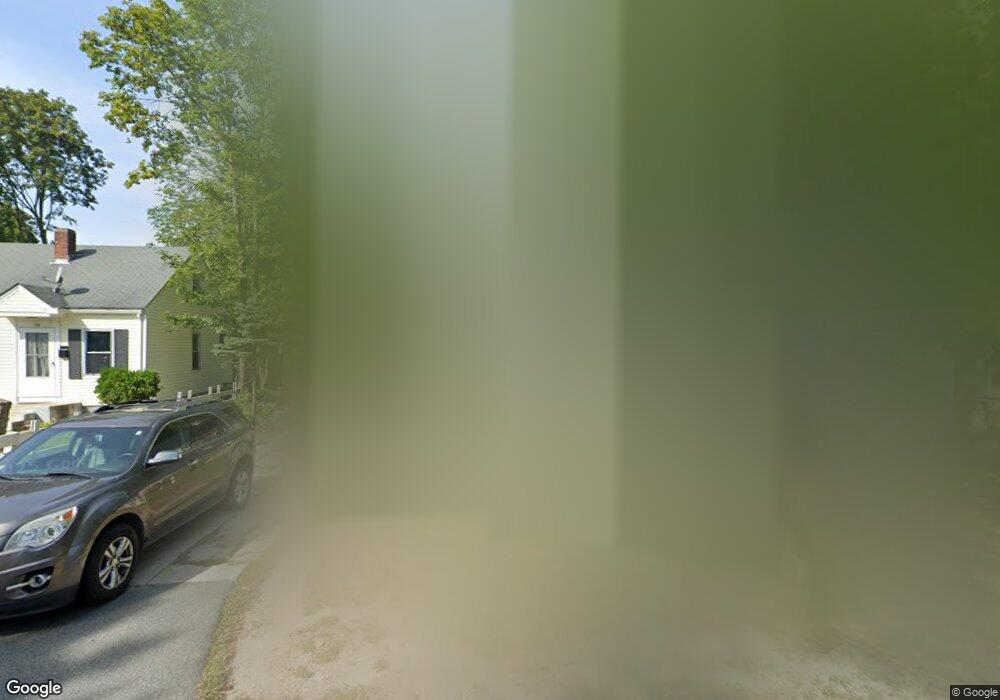
68 Coral St Brockton, MA 02302
Campello NeighborhoodEstimated Value: $366,000 - $421,127
3
Beds
1
Bath
924
Sq Ft
$433/Sq Ft
Est. Value
About This Home
This home is located at 68 Coral St, Brockton, MA 02302 and is currently estimated at $399,782, approximately $432 per square foot. 68 Coral St is a home located in Plymouth County with nearby schools including Davis K-8 School, John F. Kennedy Elementary School, and South Middle School.
Ownership History
Date
Name
Owned For
Owner Type
Purchase Details
Closed on
Mar 31, 1999
Sold by
Vough Craig M and Vough Tammit T
Bought by
Yurkievich Ronald J and Yurkievich Lorna A
Current Estimated Value
Home Financials for this Owner
Home Financials are based on the most recent Mortgage that was taken out on this home.
Original Mortgage
$88,638
Interest Rate
6.78%
Mortgage Type
Purchase Money Mortgage
Purchase Details
Closed on
Jun 30, 1989
Sold by
Lonergan John J
Bought by
Vough Craig M
Create a Home Valuation Report for This Property
The Home Valuation Report is an in-depth analysis detailing your home's value as well as a comparison with similar homes in the area
Home Values in the Area
Average Home Value in this Area
Purchase History
| Date | Buyer | Sale Price | Title Company |
|---|---|---|---|
| Yurkievich Ronald J | $86,900 | -- | |
| Vough Craig M | $122,300 | -- |
Source: Public Records
Mortgage History
| Date | Status | Borrower | Loan Amount |
|---|---|---|---|
| Open | Vough Craig M | $133,000 | |
| Closed | Vough Craig M | $120,000 | |
| Closed | Vough Craig M | $88,638 | |
| Previous Owner | Vough Craig M | $95,000 |
Source: Public Records
Tax History Compared to Growth
Tax History
| Year | Tax Paid | Tax Assessment Tax Assessment Total Assessment is a certain percentage of the fair market value that is determined by local assessors to be the total taxable value of land and additions on the property. | Land | Improvement |
|---|---|---|---|---|
| 2025 | $4,137 | $341,600 | $136,200 | $205,400 |
| 2024 | $4,105 | $341,500 | $136,200 | $205,300 |
| 2023 | $3,897 | $300,200 | $102,000 | $198,200 |
| 2022 | $3,663 | $262,200 | $92,500 | $169,700 |
| 2021 | $3,658 | $252,300 | $76,500 | $175,800 |
| 2020 | $3,391 | $223,800 | $72,100 | $151,700 |
| 2019 | $3,305 | $212,700 | $69,700 | $143,000 |
| 2018 | $3,124 | $194,500 | $69,700 | $124,800 |
| 2017 | $2,587 | $160,700 | $69,700 | $91,000 |
| 2016 | $2,375 | $136,800 | $67,500 | $69,300 |
| 2015 | $2,138 | $117,800 | $67,500 | $50,300 |
| 2014 | $2,105 | $116,100 | $67,500 | $48,600 |
Source: Public Records
Map
Nearby Homes
- 163 S Leyden St
- 44 Baker St
- 112 Hillside Ave
- 34 Carl Ave
- 54 Ferris Ave
- 28 Wallace St
- 12 Paulin Ave
- 223 Clinton St Unit 10
- 223 Clinton St Unit 3
- 229 Sinclair Rd
- 221 Sinclair Rd
- 70 Carlisle St
- 103 Clinton St
- 265 Summer St
- 16 Yuba Cir
- 122 Sinclair Rd
- 24 Ithica Rd
- 65 Tremont St
- 35 Longworth Ave Unit 17
- 115 Market St