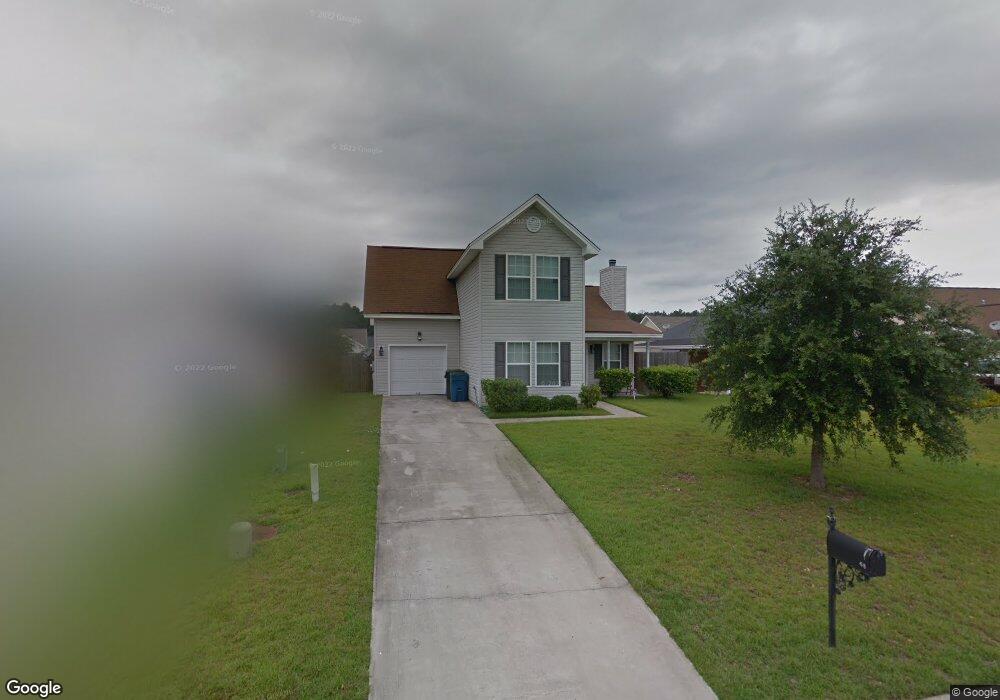
68 Cordage Cir Savannah, GA 31407
Estimated Value: $272,000 - $299,000
4
Beds
2
Baths
1,656
Sq Ft
$170/Sq Ft
Est. Value
About This Home
This home is located at 68 Cordage Cir, Savannah, GA 31407 and is currently estimated at $282,033, approximately $170 per square foot. 68 Cordage Cir is a home located in Chatham County with nearby schools including Rice Creek K-8 School and Groves High School.
Ownership History
Date
Name
Owned For
Owner Type
Purchase Details
Closed on
Mar 31, 2013
Sold by
Bland Tameka
Bought by
Bland James B
Current Estimated Value
Purchase Details
Closed on
Nov 10, 2005
Sold by
Not Provided
Bought by
Bland James and Bland Tameka
Home Financials for this Owner
Home Financials are based on the most recent Mortgage that was taken out on this home.
Original Mortgage
$131,134
Interest Rate
6%
Mortgage Type
VA
Create a Home Valuation Report for This Property
The Home Valuation Report is an in-depth analysis detailing your home's value as well as a comparison with similar homes in the area
Home Values in the Area
Average Home Value in this Area
Purchase History
| Date | Buyer | Sale Price | Title Company |
|---|---|---|---|
| Bland James B | -- | -- | |
| Bland James | $127,000 | -- |
Source: Public Records
Mortgage History
| Date | Status | Borrower | Loan Amount |
|---|---|---|---|
| Previous Owner | Bland James | $131,134 |
Source: Public Records
Tax History Compared to Growth
Tax History
| Year | Tax Paid | Tax Assessment Tax Assessment Total Assessment is a certain percentage of the fair market value that is determined by local assessors to be the total taxable value of land and additions on the property. | Land | Improvement |
|---|---|---|---|---|
| 2025 | $3,465 | $106,640 | $20,000 | $86,640 |
| 2024 | $3,465 | $95,480 | $18,000 | $77,480 |
| 2023 | $2,878 | $89,080 | $18,000 | $71,080 |
| 2022 | $2,118 | $72,120 | $8,000 | $64,120 |
| 2021 | $2,123 | $62,600 | $8,000 | $54,600 |
| 2020 | $1,837 | $60,960 | $8,000 | $52,960 |
| 2019 | $1,837 | $53,120 | $8,000 | $45,120 |
| 2018 | $1,797 | $51,360 | $8,000 | $43,360 |
| 2017 | $1,688 | $51,560 | $8,000 | $43,560 |
| 2016 | $1,446 | $44,160 | $8,000 | $36,160 |
| 2015 | $1,291 | $44,600 | $8,000 | $36,600 |
| 2014 | $1,915 | $45,120 | $0 | $0 |
Source: Public Records
Map
Nearby Homes
- 21 Hawser Way
- 56 Bearing Cir
- 58 Bearing Cir Unit B
- 32 Transom Rd
- 7 Corsair Cir
- 33 Gimbal Cir
- 76 Tiller Way
- Lot 5 Raley Rd
- Lot 6 Raley Rd
- 629 & 631 Meinhard Rd
- 217 Monteith Rd
- 135 Monteith Rd
- 35 Braxton Manor Dr
- 14 Roseberry Cir
- 15 Amber Dr
- 44 Braxton Manor Dr
- 22 Roseberry Cir
- 14 Gladewater Dr
- 6 Gladewater Dr
- 430 Punkin Bridge Rd