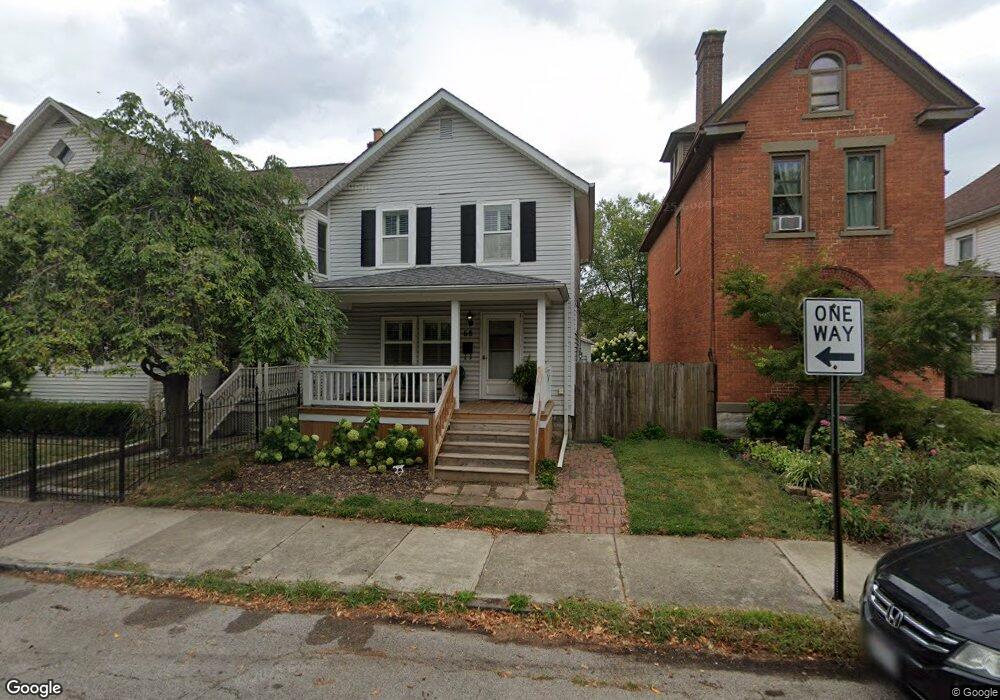
68 E Gates St Columbus, OH 43206
Merion Village NeighborhoodEstimated Value: $337,000 - $394,000
2
Beds
2
Baths
1,114
Sq Ft
$336/Sq Ft
Est. Value
About This Home
This home is located at 68 E Gates St, Columbus, OH 43206 and is currently estimated at $373,755, approximately $335 per square foot. 68 E Gates St is a home located in Franklin County with nearby schools including Stewart Alternative Elementary School @ Beck Elementary School, South High School, and Saint Mary School German Village.
Ownership History
Date
Name
Owned For
Owner Type
Purchase Details
Closed on
Apr 9, 2001
Sold by
Thacker Rebecca A
Bought by
Morton Sarah E
Current Estimated Value
Home Financials for this Owner
Home Financials are based on the most recent Mortgage that was taken out on this home.
Original Mortgage
$102,000
Outstanding Balance
$35,826
Interest Rate
7.05%
Estimated Equity
$337,929
Purchase Details
Closed on
Nov 18, 1998
Sold by
Paine Gregory S
Bought by
Thacker Rebecca A
Home Financials for this Owner
Home Financials are based on the most recent Mortgage that was taken out on this home.
Original Mortgage
$113,000
Interest Rate
6%
Purchase Details
Closed on
Dec 4, 1995
Sold by
Reynolds Robert T
Bought by
Gregory S Paine
Home Financials for this Owner
Home Financials are based on the most recent Mortgage that was taken out on this home.
Original Mortgage
$84,000
Interest Rate
7.44%
Mortgage Type
New Conventional
Purchase Details
Closed on
Oct 22, 1992
Purchase Details
Closed on
Sep 23, 1991
Create a Home Valuation Report for This Property
The Home Valuation Report is an in-depth analysis detailing your home's value as well as a comparison with similar homes in the area
Home Values in the Area
Average Home Value in this Area
Purchase History
| Date | Buyer | Sale Price | Title Company |
|---|---|---|---|
| Morton Sarah E | $132,000 | Lawyers Title | |
| Thacker Rebecca A | $119,000 | Chicago Title | |
| Gregory S Paine | $105,000 | -- | |
| -- | $77,900 | -- | |
| -- | $10,000 | -- |
Source: Public Records
Mortgage History
| Date | Status | Borrower | Loan Amount |
|---|---|---|---|
| Open | Morton Sarah E | $102,000 | |
| Previous Owner | Thacker Rebecca A | $113,000 | |
| Previous Owner | Gregory S Paine | $84,000 |
Source: Public Records
Tax History
| Year | Tax Paid | Tax Assessment Tax Assessment Total Assessment is a certain percentage of the fair market value that is determined by local assessors to be the total taxable value of land and additions on the property. | Land | Improvement |
|---|---|---|---|---|
| 2025 | $5,069 | $112,950 | $45,850 | $67,100 |
| 2024 | $5,069 | $112,950 | $45,850 | $67,100 |
| 2023 | $5,004 | $112,945 | $45,850 | $67,095 |
| 2022 | $4,282 | $82,570 | $41,160 | $41,410 |
| 2021 | $4,290 | $82,570 | $41,160 | $41,410 |
| 2020 | $4,296 | $82,570 | $41,160 | $41,410 |
| 2019 | $3,820 | $62,970 | $41,160 | $21,810 |
| 2018 | $3,797 | $62,970 | $41,160 | $21,810 |
| 2017 | $3,992 | $62,970 | $41,160 | $21,810 |
| 2016 | $4,167 | $62,900 | $22,400 | $40,500 |
| 2015 | $3,782 | $62,900 | $22,400 | $40,500 |
| 2014 | $3,792 | $62,900 | $22,400 | $40,500 |
| 2013 | $1,700 | $57,190 | $20,370 | $36,820 |
Source: Public Records
Map
Nearby Homes
- 154-156 E Gates St
- 6 Hanford St Unit 6
- 1264 S High St
- 164 Frebis Ave
- 165 Frebis Ave
- 169 Thurman Ave Unit 169
- 1366 S 4th St
- 1373 S 4th St
- 1361 City Park Ave
- 1367 City Park Ave
- 247-249 Thurman Ave
- 259 Thurman Ave
- 1389 S 6th St
- 10 - 20 E Deshler Ave
- 1036 S Front St
- 37 Stewart Ave
- 320 E Mithoff St
- 995 S Wall St
- 332 E Mithoff St
- 272 E Jenkins Ave
- 74 E Gates St
- 64 E Gates St
- 76 E Gates St Unit 78
- 60 E Gates St
- 78 E Gates St
- 78 E Gates St Unit 78 East Gates Street
- 56 E Gates St
- 82 E Gates St
- 80 E Gates St
- 80 E Gates St Unit 80 & 82
- 67 1/2 E Mithoff St
- 67 E Mithoff St Unit 1/2
- 86 E Gates St
- 1184 City Park Ave Unit 186
- 52 E Gates St
- 1186 City Park Ave
- 75 E Mithoff St
- 81 E Mithoff St
- 90 E Gates St
- 75 E Gates St
Your Personal Tour Guide
Ask me questions while you tour the home.