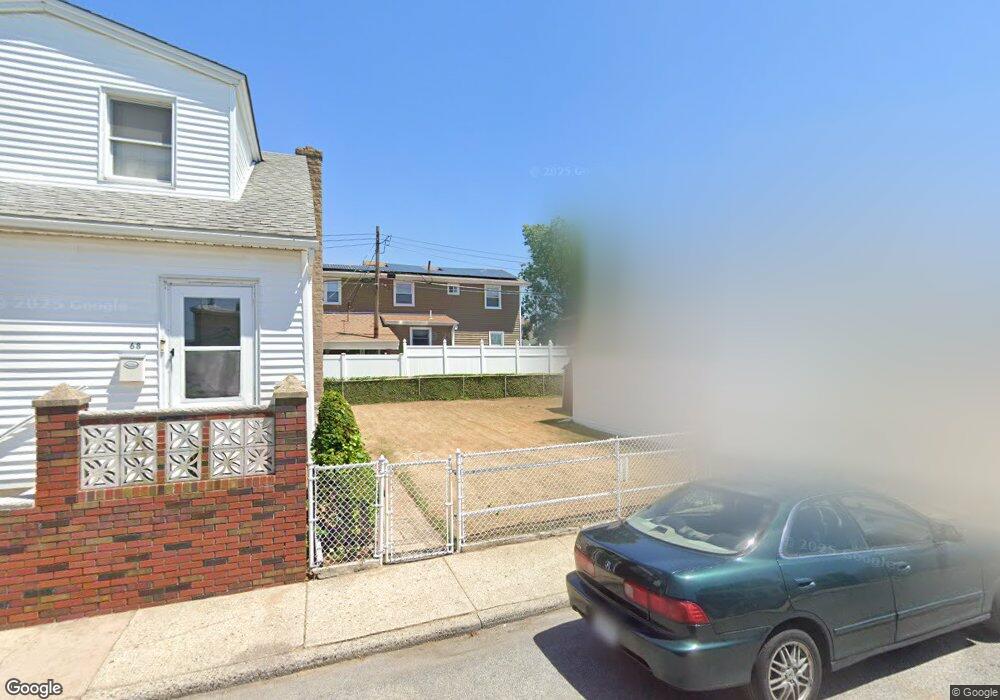
68 Ebony Ct Brooklyn, NY 11229
Gerritsen Beach NeighborhoodEstimated Value: $516,000 - $716,000
Studio
--
Bath
1,085
Sq Ft
$575/Sq Ft
Est. Value
About This Home
This home is located at 68 Ebony Ct, Brooklyn, NY 11229 and is currently estimated at $624,269, approximately $575 per square foot. 68 Ebony Ct is a home located in Kings County with nearby schools including P.S. 277 Gerritsen Beach, J.H.S. 278 Marine Park, and New Visions Charter High School for Advanced Math/ Science.
Ownership History
Date
Name
Owned For
Owner Type
Purchase Details
Closed on
Apr 17, 2024
Sold by
Nugent Michael
Bought by
Frascati Christopher L and Frascati Nicholas
Current Estimated Value
Home Financials for this Owner
Home Financials are based on the most recent Mortgage that was taken out on this home.
Original Mortgage
$456,000
Outstanding Balance
$448,136
Interest Rate
6.74%
Mortgage Type
Purchase Money Mortgage
Estimated Equity
$176,133
Purchase Details
Closed on
Dec 31, 2004
Sold by
Nugent William
Bought by
Nugent Michael
Purchase Details
Closed on
Dec 8, 2001
Sold by
Nugent William J
Bought by
Nugent William J
Create a Home Valuation Report for This Property
The Home Valuation Report is an in-depth analysis detailing your home's value as well as a comparison with similar homes in the area
Home Values in the Area
Average Home Value in this Area
Purchase History
| Date | Buyer | Sale Price | Title Company |
|---|---|---|---|
| Frascati Christopher L | $480,000 | -- | |
| Frascati Christopher L | $480,000 | -- | |
| Frascati Christopher L | $480,000 | -- | |
| Nugent Michael | -- | -- | |
| Nugent Michael | -- | -- | |
| Nugent William J | -- | -- | |
| Nugent William J | -- | -- |
Source: Public Records
Mortgage History
| Date | Status | Borrower | Loan Amount |
|---|---|---|---|
| Open | Frascati Christopher L | $456,000 | |
| Closed | Frascati Christopher L | $456,000 |
Source: Public Records
Tax History
| Year | Tax Paid | Tax Assessment Tax Assessment Total Assessment is a certain percentage of the fair market value that is determined by local assessors to be the total taxable value of land and additions on the property. | Land | Improvement |
|---|---|---|---|---|
| 2025 | $1,518 | $38,820 | $14,220 | $24,600 |
| 2024 | $1,518 | $36,060 | $14,220 | $21,840 |
| 2023 | $1,388 | $39,540 | $14,220 | $25,320 |
| 2022 | $1,303 | $39,420 | $14,220 | $25,200 |
| 2021 | $1,448 | $38,580 | $14,220 | $24,360 |
| 2020 | $1,052 | $34,080 | $14,220 | $19,860 |
| 2019 | $1,237 | $37,500 | $14,220 | $23,280 |
| 2018 | $1,079 | $21,854 | $11,211 | $10,643 |
| 2017 | $1,252 | $20,780 | $10,217 | $10,563 |
| 2016 | $1,456 | $20,780 | $8,686 | $12,094 |
| 2015 | $743 | $20,228 | $10,496 | $9,732 |
| 2014 | $743 | $19,108 | $9,914 | $9,194 |
Source: Public Records
Map
Nearby Homes
Your Personal Tour Guide
Ask me questions while you tour the home.