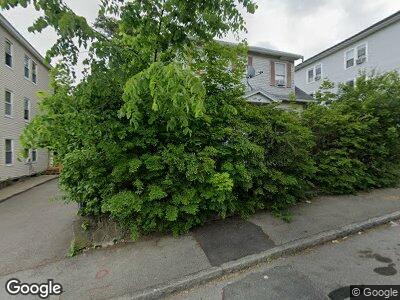
68 Gage St Worcester, MA 01605
Shrewsbury Street NeighborhoodEstimated Value: $430,284 - $500,000
2
Beds
1
Bath
900
Sq Ft
$520/Sq Ft
Est. Value
About This Home
This home is located at 68 Gage St, Worcester, MA 01605 and is currently estimated at $467,821, approximately $519 per square foot. 68 Gage St is a home located in Worcester County with nearby schools including City View, Jacob Hiatt Magnet School, and Chandler Magnet.
Ownership History
Date
Name
Owned For
Owner Type
Purchase Details
Closed on
Nov 7, 2005
Sold by
Maruca Margareta S and Maruca Nicholas J
Bought by
Kimball Gregory A
Current Estimated Value
Home Financials for this Owner
Home Financials are based on the most recent Mortgage that was taken out on this home.
Original Mortgage
$269,780
Interest Rate
5.85%
Mortgage Type
Purchase Money Mortgage
Purchase Details
Closed on
Dec 23, 1999
Sold by
Maruca Anthony and Maruca Brenda
Bought by
Maruca Nicholas and Maruca Margarita
Purchase Details
Closed on
Oct 31, 1994
Sold by
Carofaniello Philip
Bought by
Maruca Anthony and Maruca Brenda
Purchase Details
Closed on
Jun 20, 1990
Sold by
Dennis Judith I
Bought by
Carofaniello Philip P
Create a Home Valuation Report for This Property
The Home Valuation Report is an in-depth analysis detailing your home's value as well as a comparison with similar homes in the area
Home Values in the Area
Average Home Value in this Area
Purchase History
| Date | Buyer | Sale Price | Title Company |
|---|---|---|---|
| Kimball Gregory A | $272,000 | -- | |
| Maruca Nicholas | $110,000 | -- | |
| Maruca Anthony | $90,000 | -- | |
| Carofaniello Philip P | $60,000 | -- |
Source: Public Records
Mortgage History
| Date | Status | Borrower | Loan Amount |
|---|---|---|---|
| Open | Kimball Gregory A | $65,373 | |
| Open | Carofaniello Philip P | $267,452 | |
| Closed | Kimball Gregory A | $269,780 | |
| Previous Owner | Carofaniello Philip P | $212,000 |
Source: Public Records
Tax History Compared to Growth
Tax History
| Year | Tax Paid | Tax Assessment Tax Assessment Total Assessment is a certain percentage of the fair market value that is determined by local assessors to be the total taxable value of land and additions on the property. | Land | Improvement |
|---|---|---|---|---|
| 2025 | $5,199 | $394,200 | $98,600 | $295,600 |
| 2024 | $5,006 | $364,100 | $98,600 | $265,500 |
| 2023 | $4,688 | $326,900 | $85,800 | $241,100 |
| 2022 | $4,514 | $296,800 | $68,600 | $228,200 |
| 2021 | $3,990 | $245,100 | $54,900 | $190,200 |
| 2020 | $3,760 | $221,200 | $54,500 | $166,700 |
| 2019 | $3,852 | $214,000 | $47,700 | $166,300 |
| 2018 | $3,784 | $200,100 | $47,700 | $152,400 |
| 2017 | $3,600 | $187,300 | $47,700 | $139,600 |
| 2016 | $3,526 | $171,100 | $34,300 | $136,800 |
| 2015 | $3,434 | $171,100 | $34,300 | $136,800 |
| 2014 | $3,343 | $171,100 | $34,300 | $136,800 |
Source: Public Records
Map
Nearby Homes