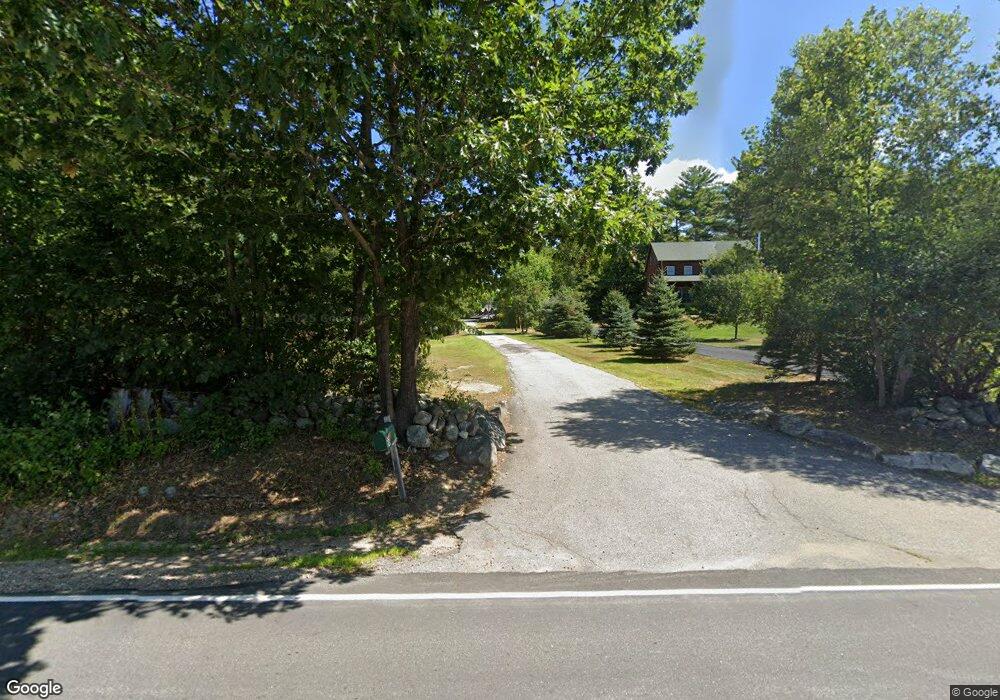
68 Holland St Moultonborough, NH 03254
Estimated Value: $784,000 - $1,087,592
3
Beds
3
Baths
3,169
Sq Ft
$282/Sq Ft
Est. Value
About This Home
This home is located at 68 Holland St, Moultonborough, NH 03254 and is currently estimated at $893,531, approximately $281 per square foot. 68 Holland St is a home located in Carroll County with nearby schools including Moultonborough Central School and Moultonborough Academy High School.
Ownership History
Date
Name
Owned For
Owner Type
Purchase Details
Closed on
Apr 1, 2024
Sold by
Pearson Eric G and Pearson Jean W
Bought by
Eric & Jean Pearson Ret and Pearson
Current Estimated Value
Purchase Details
Closed on
Dec 24, 2001
Sold by
Peaslee Susan J
Bought by
Pearson Eric G and Pearson Jean W
Create a Home Valuation Report for This Property
The Home Valuation Report is an in-depth analysis detailing your home's value as well as a comparison with similar homes in the area
Home Values in the Area
Average Home Value in this Area
Purchase History
| Date | Buyer | Sale Price | Title Company |
|---|---|---|---|
| Eric & Jean Pearson Ret | -- | None Available | |
| Eric & Jean Pearson Ret | -- | None Available | |
| Pearson Eric G | $160,000 | -- | |
| Pearson Eric G | $160,000 | -- |
Source: Public Records
Mortgage History
| Date | Status | Borrower | Loan Amount |
|---|---|---|---|
| Previous Owner | Pearson Eric G | $395,475 |
Source: Public Records
Tax History Compared to Growth
Tax History
| Year | Tax Paid | Tax Assessment Tax Assessment Total Assessment is a certain percentage of the fair market value that is determined by local assessors to be the total taxable value of land and additions on the property. | Land | Improvement |
|---|---|---|---|---|
| 2024 | $5,340 | $945,100 | $462,300 | $482,800 |
| 2023 | $5,112 | $896,800 | $419,400 | $477,400 |
| 2022 | $3,635 | $760,500 | $323,200 | $437,300 |
| 2021 | $4,193 | $600,700 | $228,200 | $372,500 |
| 2020 | $4,076 | $571,700 | $214,700 | $357,000 |
| 2019 | $4,256 | $595,200 | $209,300 | $385,900 |
| 2018 | $4,341 | $562,300 | $179,400 | $382,900 |
| 2017 | $4,339 | $527,800 | $179,400 | $348,400 |
| 2016 | $4,468 | $511,200 | $173,400 | $337,800 |
| 2015 | $4,351 | $482,900 | $173,400 | $309,500 |
| 2014 | $4,090 | $461,600 | $173,400 | $288,200 |
| 2013 | $4,035 | $464,300 | $173,400 | $290,900 |
Source: Public Records
Map
Nearby Homes
- 139 Skyline Dr
- 17 Whitehouse Farm Ln
- 2 Garland Pond Rd
- 0 Garland Pond Rd Unit 76
- 11 Harriet Ln
- M:027 L:002-001 Sheridan Rd
- M:027 L:002 Sheridan Rd
- 19 Abenaki Ln
- 69 Buoniello Rd
- 66 Hayes Ln
- 0 Moose Walk
- 647 Whittier Hwy
- 284 Ossipee Mountain Rd
- 28 Moose Walk
- 371 Range Rd
- 16 Buckingham Terrace
- 284 Wentworth Hill Rd
- 7 Eden Ln
- 16 Myrtle Dr
- 100 Marvin Rd
- 90 Holland St
- 4.5 Field Stone Way
- 4.4 Field Stone Way
- 60 Holland St
- 4.6 Field Stone Way
- 52 Holland St
- 23 Holland Hill Rd
- 22 Holland St
- 97 Holland St
- 18 Holland St
- 112 Holland St
- 103 Holland St
- 27 Holland St
- 118 Holland St
- 34 Berry Pond Way
- 4 Fieldstone Way
- 32 Berry Pond Way
- 24 Fieldstone Way
- 123 Holland St
- 14 Holland St