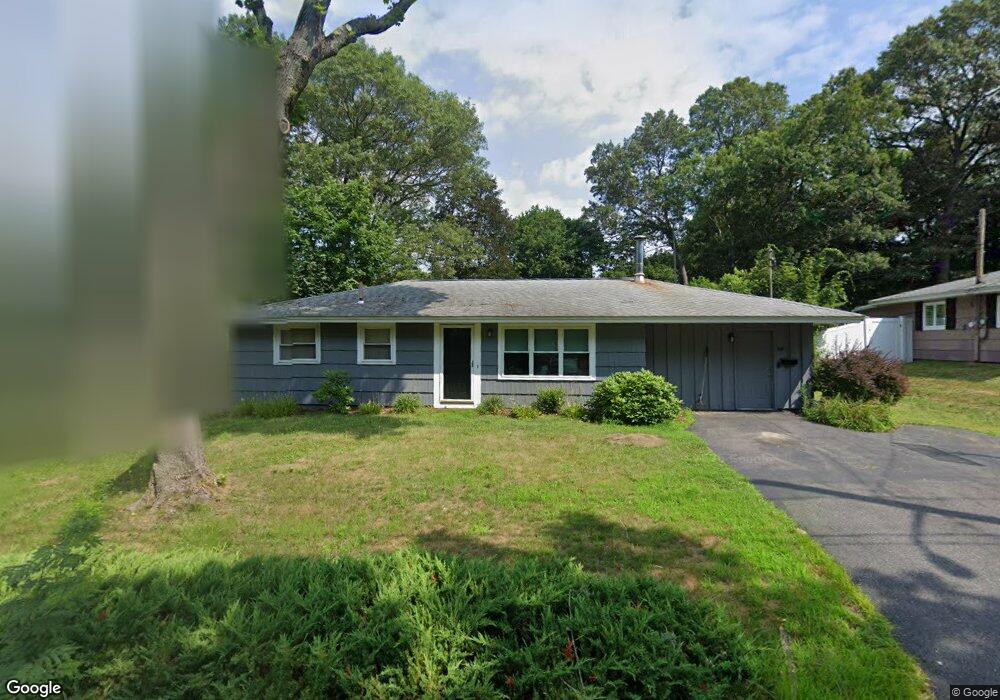
68 Mildred Rd Brockton, MA 02302
Estimated Value: $363,000 - $480,000
3
Beds
1
Bath
1,172
Sq Ft
$367/Sq Ft
Est. Value
About This Home
This home is located at 68 Mildred Rd, Brockton, MA 02302 and is currently estimated at $429,928, approximately $366 per square foot. 68 Mildred Rd is a home located in Plymouth County with nearby schools including Brookfield Elementary School, Mary E. Baker Elementary School, and Downey Elementary School.
Ownership History
Date
Name
Owned For
Owner Type
Purchase Details
Closed on
Jun 24, 2024
Sold by
Briggs Lisa J
Bought by
Briggs Ft and Briggs
Current Estimated Value
Purchase Details
Closed on
May 30, 1991
Sold by
Aetna Finance Co and Itt Financial Svc
Bought by
Briggs George W and Briggs Lisa J
Purchase Details
Closed on
May 18, 1990
Sold by
Tassinari David G
Bought by
Aetna Finance Co
Create a Home Valuation Report for This Property
The Home Valuation Report is an in-depth analysis detailing your home's value as well as a comparison with similar homes in the area
Purchase History
| Date | Buyer | Sale Price | Title Company |
|---|---|---|---|
| Briggs Ft | -- | None Available | |
| Briggs Ft | -- | None Available | |
| Briggs George W | $67,000 | -- | |
| Aetna Finance Co | $78,500 | -- |
Source: Public Records
Mortgage History
| Date | Status | Borrower | Loan Amount |
|---|---|---|---|
| Previous Owner | Aetna Finance Co | $47,000 | |
| Previous Owner | Aetna Finance Co | $20,000 | |
| Previous Owner | Aetna Finance Co | $63,000 |
Source: Public Records
Tax History
| Year | Tax Paid | Tax Assessment Tax Assessment Total Assessment is a certain percentage of the fair market value that is determined by local assessors to be the total taxable value of land and additions on the property. | Land | Improvement |
|---|---|---|---|---|
| 2025 | $4,794 | $395,900 | $146,400 | $249,500 |
| 2024 | $4,643 | $386,300 | $146,400 | $239,900 |
| 2023 | $4,509 | $347,400 | $111,400 | $236,000 |
| 2022 | $4,205 | $301,000 | $101,400 | $199,600 |
| 2021 | $4,160 | $286,900 | $95,900 | $191,000 |
| 2020 | $4,086 | $269,700 | $91,800 | $177,900 |
| 2019 | $3,667 | $236,000 | $86,200 | $149,800 |
| 2018 | $3,577 | $222,700 | $86,200 | $136,500 |
| 2017 | $3,189 | $198,100 | $86,200 | $111,900 |
| 2016 | $3,083 | $177,600 | $82,200 | $95,400 |
| 2015 | $2,791 | $153,800 | $82,200 | $71,600 |
| 2014 | $2,794 | $154,100 | $82,200 | $71,900 |
Source: Public Records
Map
Nearby Homes
Your Personal Tour Guide
Ask me questions while you tour the home.