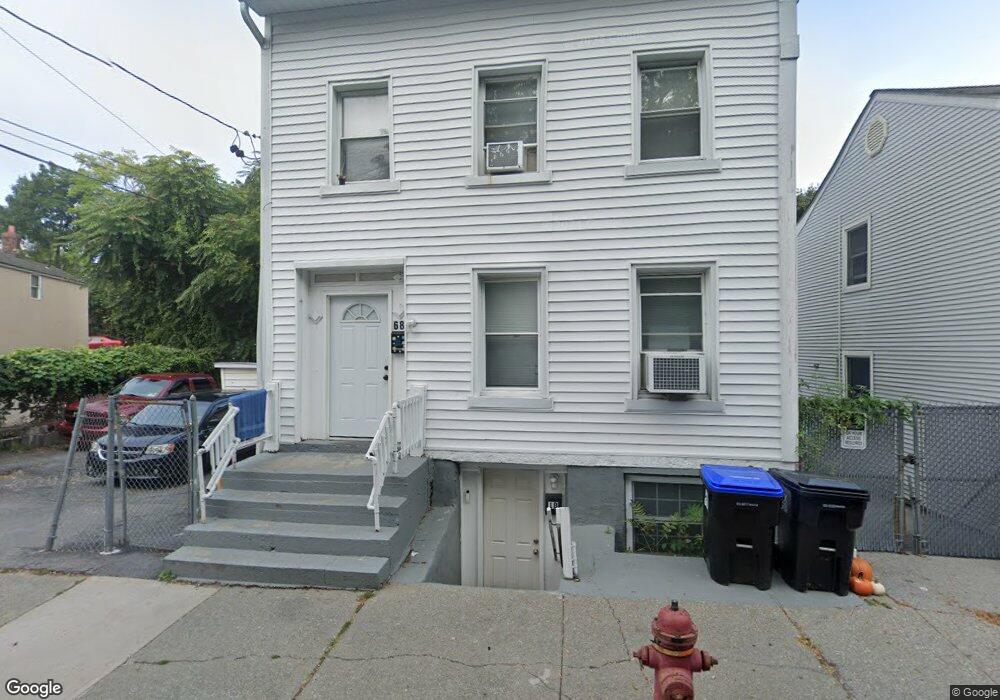
68 N Bridge St Poughkeepsie, NY 12601
Estimated Value: $298,000 - $406,000
4
Beds
2
Baths
1,300
Sq Ft
$275/Sq Ft
Est. Value
About This Home
This home is located at 68 N Bridge St, Poughkeepsie, NY 12601 and is currently estimated at $357,196, approximately $274 per square foot. 68 N Bridge St is a home located in Dutchess County with nearby schools including Poughkeepsie High School, Faith Christian Academy, and Tabernacle Christian Academy.
Ownership History
Date
Name
Owned For
Owner Type
Purchase Details
Closed on
Jun 25, 2025
Sold by
Taberna 200 Llc
Bought by
Khan Shafayet
Current Estimated Value
Home Financials for this Owner
Home Financials are based on the most recent Mortgage that was taken out on this home.
Original Mortgage
$300,000
Outstanding Balance
$299,496
Interest Rate
6.89%
Mortgage Type
New Conventional
Estimated Equity
$57,700
Purchase Details
Closed on
Jan 24, 2022
Sold by
Pitcher Lawrence and Coleman Toni D
Bought by
Teberna 200 Llc
Purchase Details
Closed on
Oct 3, 2019
Sold by
Coleman Toni D and Pitcher Lawrence
Bought by
Teberna 200 Llc
Purchase Details
Closed on
Oct 1, 2007
Sold by
Wells Fargo Bank Na
Bought by
Coleman Toni
Home Financials for this Owner
Home Financials are based on the most recent Mortgage that was taken out on this home.
Original Mortgage
$117,000
Interest Rate
6.49%
Mortgage Type
Purchase Money Mortgage
Purchase Details
Closed on
Nov 21, 2006
Sold by
Anozie James
Bought by
Wells Fargo Bank Na
Purchase Details
Closed on
Dec 1, 2004
Sold by
Spadaro Frank
Bought by
Anozie James
Purchase Details
Closed on
Nov 14, 2001
Create a Home Valuation Report for This Property
The Home Valuation Report is an in-depth analysis detailing your home's value as well as a comparison with similar homes in the area
Home Values in the Area
Average Home Value in this Area
Purchase History
| Date | Buyer | Sale Price | Title Company |
|---|---|---|---|
| Khan Shafayet | $378,000 | -- | |
| Teberna 200 Llc | $100,000 | None Available | |
| Teberna 200 Llc | $100,000 | None Available | |
| Coleman Toni | $130,000 | -- | |
| Coleman Toni | $130,000 | -- | |
| Wells Fargo Bank Na | $249,050 | -- | |
| Wells Fargo Bank Na | $249,050 | -- | |
| Anozie James | $260,000 | -- | |
| Anozie James | $260,000 | -- | |
| -- | $74,094 | -- | |
| -- | $74,094 | -- |
Source: Public Records
Mortgage History
| Date | Status | Borrower | Loan Amount |
|---|---|---|---|
| Open | Khan Shafayet | $300,000 | |
| Previous Owner | Coleman Toni | $117,000 |
Source: Public Records
Tax History Compared to Growth
Tax History
| Year | Tax Paid | Tax Assessment Tax Assessment Total Assessment is a certain percentage of the fair market value that is determined by local assessors to be the total taxable value of land and additions on the property. | Land | Improvement |
|---|---|---|---|---|
| 2024 | $6,433 | $254,400 | $29,700 | $224,700 |
| 2023 | $5,986 | $240,000 | $29,700 | $210,300 |
| 2022 | $4,252 | $200,000 | $27,000 | $173,000 |
| 2021 | $3,418 | $115,000 | $27,000 | $88,000 |
| 2020 | $5,284 | $100,000 | $27,000 | $73,000 |
| 2019 | $5,930 | $138,300 | $27,000 | $111,300 |
| 2018 | $7,334 | $130,500 | $27,000 | $103,500 |
| 2017 | $5,353 | $127,900 | $27,000 | $100,900 |
| 2016 | $5,394 | $139,000 | $27,000 | $112,000 |
| 2015 | -- | $143,300 | $27,000 | $116,300 |
| 2014 | -- | $150,800 | $27,000 | $123,800 |
Source: Public Records
Map
Nearby Homes
- 70 N Bridge St
- 74 N Bridge St Unit 3
- 74 N Bridge St Unit 1
- 74 N Bridge St Unit 2
- 74 N Bridge St
- 76 N Bridge St
- 78 N Bridge St
- 78 N Bridge St Unit 1
- 60 N Bridge St
- 80 N Bridge St
- 58 N Bridge St
- 7678 N Bridge St
- 82 N Bridge St
- 56 N Bridge St
- 3 Mansion St
- 54 N Bridge St
- 54 N Bridge St Unit 2
- 5 Mansion St
- 52 1/2 N Bridge St Unit 3
- 52 N Bridge St Unit 1