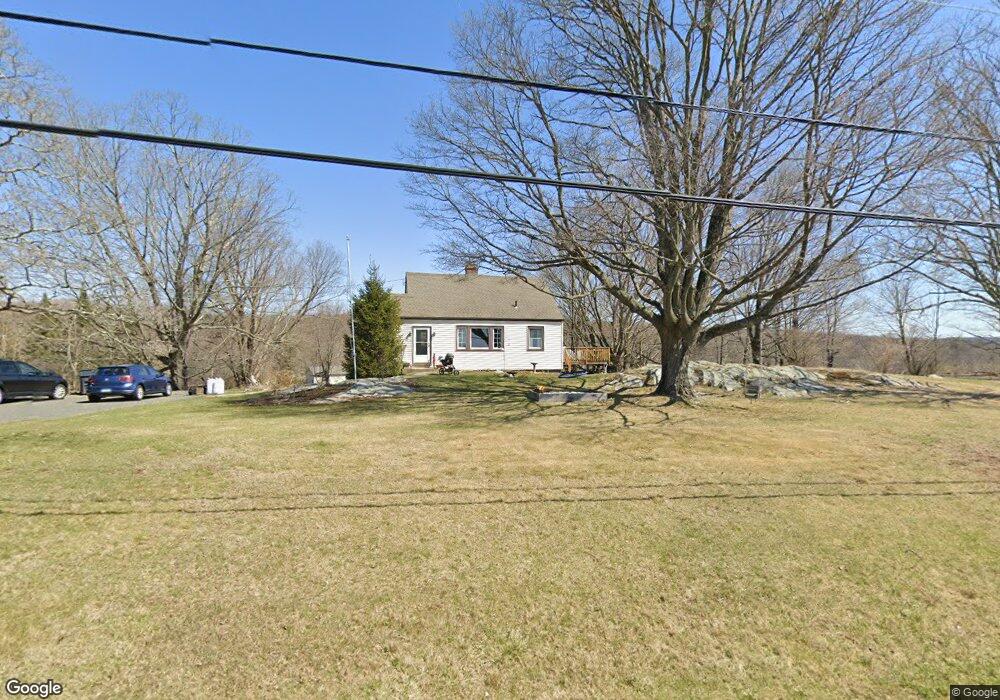
68 Northrup St Bridgewater, CT 06752
Estimated Value: $553,293 - $765,000
3
Beds
2
Baths
1,408
Sq Ft
$442/Sq Ft
Est. Value
About This Home
This home is located at 68 Northrup St, Bridgewater, CT 06752 and is currently estimated at $622,073, approximately $441 per square foot. 68 Northrup St is a home located in Litchfield County with nearby schools including Shepaug Valley School.
Ownership History
Date
Name
Owned For
Owner Type
Purchase Details
Closed on
May 24, 2016
Sold by
Smith 4Th Samuel A and Smith Dorothy J
Bought by
Little Rocky Ledge Llc
Current Estimated Value
Purchase Details
Closed on
Mar 4, 1980
Bought by
Smith Samuel A and Smith Dorothy J
Create a Home Valuation Report for This Property
The Home Valuation Report is an in-depth analysis detailing your home's value as well as a comparison with similar homes in the area
Home Values in the Area
Average Home Value in this Area
Purchase History
| Date | Buyer | Sale Price | Title Company |
|---|---|---|---|
| Little Rocky Ledge Llc | $307,000 | -- | |
| Little Rocky Ledge Llc | $307,000 | -- | |
| Smith Samuel A | -- | -- |
Source: Public Records
Mortgage History
| Date | Status | Borrower | Loan Amount |
|---|---|---|---|
| Previous Owner | Smith Samuel A | $96,558 | |
| Previous Owner | Smith Samuel A | $100,000 | |
| Previous Owner | Smith Samuel A | $50,000 |
Source: Public Records
Tax History
| Year | Tax Paid | Tax Assessment Tax Assessment Total Assessment is a certain percentage of the fair market value that is determined by local assessors to be the total taxable value of land and additions on the property. | Land | Improvement |
|---|---|---|---|---|
| 2025 | $5,715 | $300,800 | $166,600 | $134,200 |
| 2024 | $5,339 | $300,800 | $166,600 | $134,200 |
| 2023 | $5,038 | $300,800 | $166,600 | $134,200 |
| 2022 | $4,841 | $261,700 | $197,500 | $64,200 |
| 2021 | $4,580 | $261,700 | $197,500 | $64,200 |
| 2020 | $4,580 | $261,700 | $197,500 | $64,200 |
| 2019 | $4,580 | $261,700 | $197,500 | $64,200 |
| 2018 | $4,501 | $261,700 | $197,500 | $64,200 |
| 2017 | $4,501 | $261,700 | $197,500 | $64,200 |
| 2016 | $5,401 | $328,300 | $231,400 | $96,900 |
| 2015 | $5,663 | $328,300 | $231,400 | $96,900 |
| 2014 | $5,663 | $328,300 | $231,400 | $96,900 |
Source: Public Records
Map
Nearby Homes
- 408 Hut Hill Rd
- 62 Riverford Rd
- 13 Nicoles Ct
- 370 Northrop St
- 26 Cove Rd
- 190 Blueberry Hill Rd
- 409 Northrop St
- 154B Long Meadow Hill Rd
- 154A Long Meadow Hill Rd
- 109 Long Meadow Hill Rd
- 52 Curtis Rd
- 7 High Acres Rd
- 77 Old Middle Rd
- 1 Old Middle Rd
- 8 Phoebee Ln
- 95 Obtuse Hill Rd
- 99 Obtuse Hill Rd
- 95 Obtuse Rd S
- 16 Dogwood Dr
- 45 Old Pumpkin Hill Rd
Your Personal Tour Guide
Ask me questions while you tour the home.