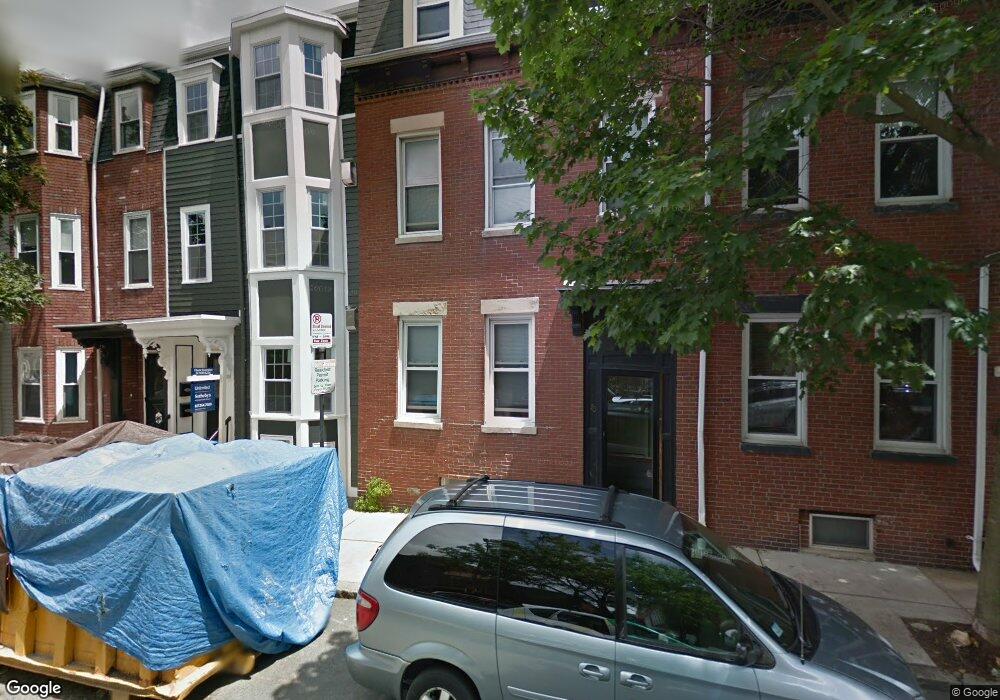
68 O St Boston, MA 02127
South Boston NeighborhoodEstimated Value: $879,000
4
Beds
5
Baths
1,026
Sq Ft
$857/Sq Ft
Est. Value
About This Home
This home is located at 68 O St, Boston, MA 02127 and is currently priced at $879,000, approximately $856 per square foot. 68 O St is a home located in Suffolk County with nearby schools including South Boston Catholic Academy, Gate of Heaven Elementary School, and St Peter Academy.
Ownership History
Date
Name
Owned For
Owner Type
Purchase Details
Closed on
Jul 12, 2016
Sold by
Instant Equity Partner
Bought by
Oleary Jacqueline G
Current Estimated Value
Home Financials for this Owner
Home Financials are based on the most recent Mortgage that was taken out on this home.
Original Mortgage
$496,000
Outstanding Balance
$396,722
Interest Rate
3.64%
Mortgage Type
New Conventional
Purchase Details
Closed on
Jul 10, 2015
Sold by
Mccarthy John F
Bought by
Instant Equity Ptnrs L
Home Financials for this Owner
Home Financials are based on the most recent Mortgage that was taken out on this home.
Original Mortgage
$526,250
Interest Rate
3.87%
Mortgage Type
Purchase Money Mortgage
Purchase Details
Closed on
Mar 20, 2012
Sold by
Mccarthy Jo A
Bought by
Mccarthy John F and Mccarthy Jo A
Purchase Details
Closed on
Jul 14, 2006
Sold by
Parker Warren A
Bought by
Mccarthy Joann and Parker Warren A
Create a Home Valuation Report for This Property
The Home Valuation Report is an in-depth analysis detailing your home's value as well as a comparison with similar homes in the area
Home Values in the Area
Average Home Value in this Area
Purchase History
| Date | Buyer | Sale Price | Title Company |
|---|---|---|---|
| Oleary Jacqueline G | $620,000 | -- | |
| Instant Equity Ptnrs L | $525,000 | -- | |
| Mccarthy John F | -- | -- | |
| Mccarthy Joann | -- | -- |
Source: Public Records
Mortgage History
| Date | Status | Borrower | Loan Amount |
|---|---|---|---|
| Open | Oleary Jacqueline G | $496,000 | |
| Previous Owner | Instant Equity Ptnrs L | $526,250 |
Source: Public Records
Tax History
| Year | Tax Paid | Tax Assessment Tax Assessment Total Assessment is a certain percentage of the fair market value that is determined by local assessors to be the total taxable value of land and additions on the property. | Land | Improvement |
|---|---|---|---|---|
| 2025 | $0 | $0 | $0 | $0 |
| 2024 | $0 | $0 | $0 | $0 |
| 2023 | $0 | $0 | $0 | $0 |
| 2022 | $0 | $0 | $0 | $0 |
| 2021 | $0 | $0 | $0 | $0 |
| 2020 | $0 | $0 | $0 | $0 |
| 2019 | $0 | $0 | $0 | $0 |
| 2018 | $0 | $0 | $0 | $0 |
| 2017 | $8,811 | $832,020 | $154,728 | $677,292 |
| 2016 | $5,510 | $500,900 | $184,200 | $316,700 |
| 2015 | $5,017 | $414,300 | $135,800 | $278,500 |
| 2014 | $4,918 | $390,900 | $135,800 | $255,100 |
Source: Public Records
Map
Nearby Homes
- 867 E Broadway
- 885 E Broadway
- 861 E Broadway
- 901 E Broadway Unit 1
- 802 E 3rd St Unit 3
- 840 E 4th St Unit 1
- 881 E 2nd St Unit 13
- 862 E 2nd St Unit 6
- 838 E Broadway Unit 7
- 14 O St Unit 3
- 38 P St Unit 3
- 9 O St Unit 1
- 7 Kemble Place
- 933 E Broadway
- 891 E 1st St Unit 4
- 722 E 5th St Unit TH
- 755 E 5th St Unit 757
- 729-731 E 5th St
- 37 Farragut Rd Unit 7
- 37 Farragut Rd Unit 6
Your Personal Tour Guide
Ask me questions while you tour the home.