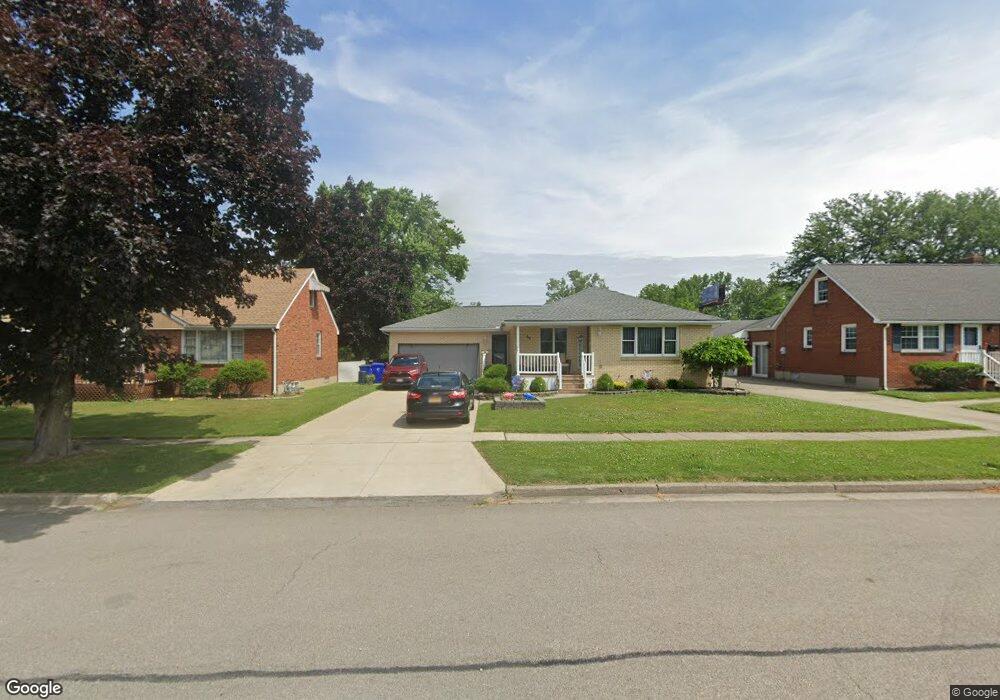
68 Robin Ln Buffalo, NY 14224
Estimated Value: $255,357 - $285,000
3
Beds
1
Bath
1,352
Sq Ft
$198/Sq Ft
Est. Value
About This Home
This home is located at 68 Robin Ln, Buffalo, NY 14224 and is currently estimated at $268,339, approximately $198 per square foot. 68 Robin Ln is a home located in Erie County with nearby schools including East Middle School, West Seneca East Senior High School, and Trinity Lutheran School.
Ownership History
Date
Name
Owned For
Owner Type
Purchase Details
Closed on
Aug 31, 2020
Sold by
Fredenburg Robert M
Bought by
Fredenburg Karen M
Current Estimated Value
Home Financials for this Owner
Home Financials are based on the most recent Mortgage that was taken out on this home.
Original Mortgage
$58,965
Interest Rate
2.9%
Mortgage Type
New Conventional
Purchase Details
Closed on
Feb 10, 1997
Sold by
Wisniewski Dorothy
Bought by
Fredenburg Robert M and Fredenburg Karen M
Purchase Details
Closed on
Jan 3, 1997
Purchase Details
Closed on
Dec 5, 1996
Create a Home Valuation Report for This Property
The Home Valuation Report is an in-depth analysis detailing your home's value as well as a comparison with similar homes in the area
Home Values in the Area
Average Home Value in this Area
Purchase History
| Date | Buyer | Sale Price | Title Company |
|---|---|---|---|
| Fredenburg Karen M | -- | Sct | |
| Fredenburg Robert M | $55,000 | -- | |
| -- | -- | -- | |
| -- | -- | -- |
Source: Public Records
Mortgage History
| Date | Status | Borrower | Loan Amount |
|---|---|---|---|
| Closed | Fredenburg Karen M | $58,965 |
Source: Public Records
Tax History Compared to Growth
Tax History
| Year | Tax Paid | Tax Assessment Tax Assessment Total Assessment is a certain percentage of the fair market value that is determined by local assessors to be the total taxable value of land and additions on the property. | Land | Improvement |
|---|---|---|---|---|
| 2024 | -- | $53,900 | $9,000 | $44,900 |
| 2023 | $5,281 | $53,900 | $9,000 | $44,900 |
| 2022 | $5,219 | $53,900 | $9,000 | $44,900 |
| 2021 | $5,182 | $53,900 | $9,000 | $44,900 |
| 2020 | $4,673 | $53,900 | $9,000 | $44,900 |
| 2019 | $4,515 | $53,900 | $9,000 | $44,900 |
| 2018 | $4,486 | $53,900 | $9,000 | $44,900 |
| 2017 | $2,379 | $53,900 | $9,000 | $44,900 |
| 2016 | $4,235 | $53,900 | $9,000 | $44,900 |
| 2015 | -- | $53,900 | $9,000 | $44,900 |
| 2014 | -- | $53,900 | $9,000 | $44,900 |
Source: Public Records
Map
Nearby Homes