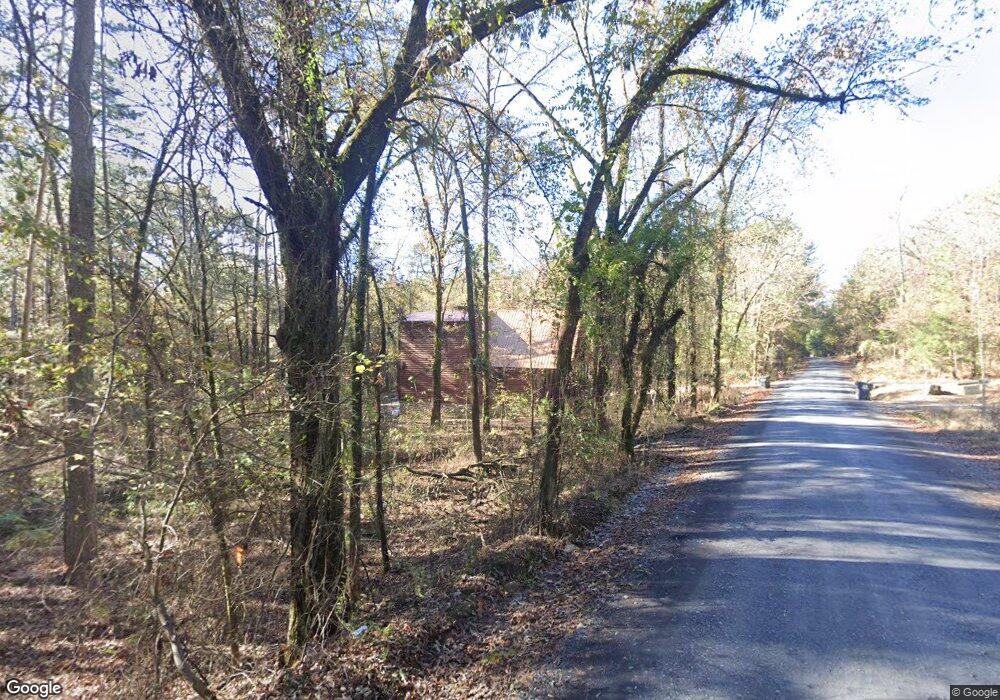
68 Stevens Rd Broken Bow, OK 74728
Estimated Value: $588,953 - $863,000
3
Beds
3
Baths
1,780
Sq Ft
$397/Sq Ft
Est. Value
About This Home
This home is located at 68 Stevens Rd, Broken Bow, OK 74728 and is currently estimated at $706,488, approximately $396 per square foot. 68 Stevens Rd is a home located in McCurtain County with nearby schools including Battiest Elementary School and Battiest High School.
Ownership History
Date
Name
Owned For
Owner Type
Purchase Details
Closed on
Feb 28, 2017
Sold by
Wooten Lori and Wooten Tom
Bought by
Stevens Mckelroy Colin Patrick and Stevens Mckelroy Pamela
Current Estimated Value
Home Financials for this Owner
Home Financials are based on the most recent Mortgage that was taken out on this home.
Original Mortgage
$315,000
Outstanding Balance
$258,730
Interest Rate
4.09%
Mortgage Type
Commercial
Estimated Equity
$447,758
Purchase Details
Closed on
Apr 30, 2015
Sold by
Jones Richard Selwyn and Buchanan Jo Ann
Bought by
Wooten Lori and Wooten Tom
Home Financials for this Owner
Home Financials are based on the most recent Mortgage that was taken out on this home.
Original Mortgage
$18,105
Interest Rate
3.73%
Mortgage Type
Unknown
Purchase Details
Closed on
Jul 1, 2013
Sold by
Reed Charles L and Reed Vojai A
Bought by
Jones Richard Selwyn and Buchanan Jo Ann
Purchase Details
Closed on
Oct 9, 2008
Sold by
Hochatown Properties Llc
Bought by
Reed Charles L and Reed Vojai A
Create a Home Valuation Report for This Property
The Home Valuation Report is an in-depth analysis detailing your home's value as well as a comparison with similar homes in the area
Home Values in the Area
Average Home Value in this Area
Purchase History
| Date | Buyer | Sale Price | Title Company |
|---|---|---|---|
| Stevens Mckelroy Colin Patrick | $420,000 | None Available | |
| Wooten Lori | $235,000 | None Available | |
| Jones Richard Selwyn | $5,000 | None Available | |
| Reed Charles L | -- | -- |
Source: Public Records
Mortgage History
| Date | Status | Borrower | Loan Amount |
|---|---|---|---|
| Open | Stevens Mckelroy Colin Patrick | $315,000 | |
| Previous Owner | Wooten Lori | $18,105 |
Source: Public Records
Tax History
| Year | Tax Paid | Tax Assessment Tax Assessment Total Assessment is a certain percentage of the fair market value that is determined by local assessors to be the total taxable value of land and additions on the property. | Land | Improvement |
|---|---|---|---|---|
| 2025 | $3,226 | $40,568 | $8,034 | $32,534 |
| 2024 | $3,073 | $38,636 | $8,034 | $30,602 |
| 2023 | $3,055 | $36,796 | $8,034 | $28,762 |
| 2022 | $3,836 | $46,200 | $5,500 | $40,700 |
| 2021 | $3,963 | $46,200 | $5,500 | $40,700 |
| 2020 | $3,881 | $46,200 | $5,500 | $40,700 |
| 2019 | $4,016 | $46,200 | $5,500 | $40,700 |
| 2018 | $2,253 | $25,654 | $5,500 | $20,154 |
| 2017 | $1,986 | $24,432 | $5,500 | $18,932 |
| 2016 | $211 | $2,585 | $2,585 | $0 |
| 2015 | $217 | $2,585 | $2,585 | $0 |
| 2014 | $64 | $829 | $829 | $0 |
Source: Public Records
Map
Nearby Homes
- 26 Mangrove Rd
- 107 Mahogany Rd
- 172 Cedar Creek Cir
- 250 Almond Ln
- 18 Western Fir Ln
- 253 Western Pine Trail
- 43 Western Maple Ct
- 167 Penner Rd
- 158 Western Maple Trail
- 258 Pinehurst Ln
- 79 Forest Brook Loop
- 15 Forest Brook Loop Unit LOT 15
- 12 Forest Brook Loop
- 2 Forest Brook Loop Unit Lot 2
- 10 Forest Brook Loop Unit LOT 10
- 4 Forest Brook Loop Unit LOT 4
- 16 Forest Brook Loop Unit LOT 16
- 143 Western Cedar Trail
- 63 Western Cedar Trail
- 132 Western Cedar Trail
- 121 Stevens Rd
- 51 Stevens Rd
- 114 Stevens Rd
- 41 Mangrove Rd
- 72 Mangrove Rd
- 85 Mangrove Rd
- 129 Mangrove Rd
- 0 Stevens Rd Unit 1824664
- 20 Mahogany Rd
- 55 Mahogany
- 200 Stevens Rd
- 120 Pecan Bend Ln
- 50 Mahogany Rd
- 184 Mangrove Rd
- 1 Pecan Bend Ln
- Pt. 1 Pecan Bend Ln
- Pt.1 Pecan Bend Ln
- 0 Pecan Bend Ln
- 225 Stevens Rd
- 53 Mahogany Rd
Your Personal Tour Guide
Ask me questions while you tour the home.