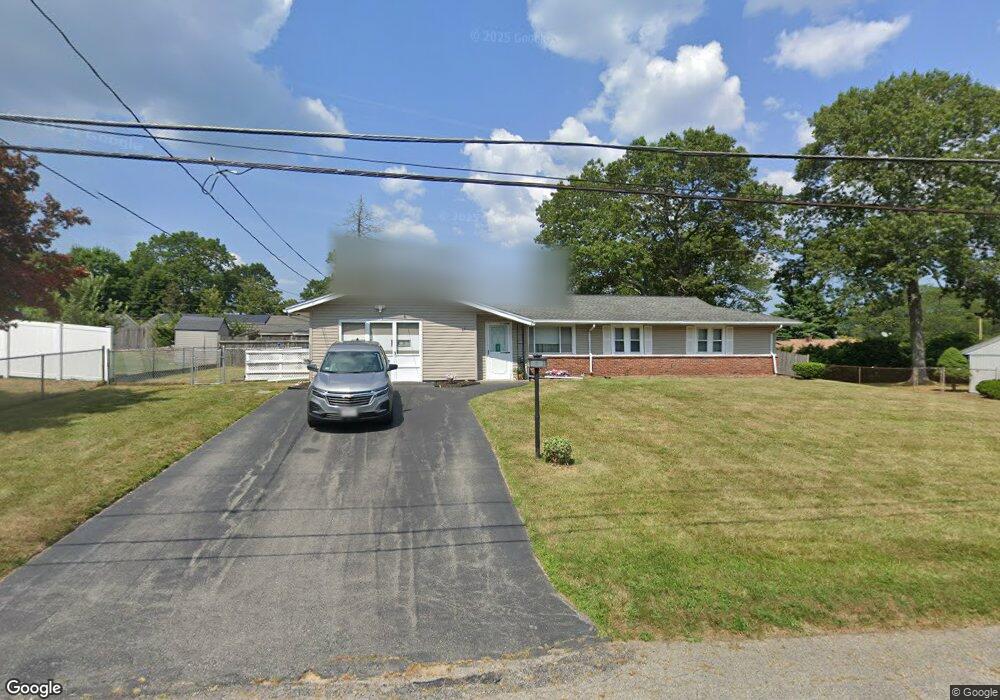
68 Temi Rd Brockton, MA 02302
Estimated Value: $495,000 - $539,000
3
Beds
2
Baths
1,824
Sq Ft
$284/Sq Ft
Est. Value
About This Home
This home is located at 68 Temi Rd, Brockton, MA 02302 and is currently estimated at $517,206, approximately $283 per square foot. 68 Temi Rd is a home located in Plymouth County with nearby schools including Brookfield Elementary School, Mary E. Baker Elementary School, and Downey Elementary School.
Ownership History
Date
Name
Owned For
Owner Type
Purchase Details
Closed on
Aug 23, 2018
Sold by
Fahey Joan L
Bought by
Fahey Roberta J
Current Estimated Value
Purchase Details
Closed on
Aug 23, 2016
Sold by
Fahey Joan L
Bought by
Fahey Roberta J
Purchase Details
Closed on
Aug 11, 2016
Sold by
Fahey Roberta J
Bought by
Fahey Joan L
Purchase Details
Closed on
May 3, 2016
Sold by
Joan L Fahey Irt
Bought by
Fahey Roberta J
Purchase Details
Closed on
Jun 9, 2014
Sold by
Fahey Joan L
Bought by
Joan L Fahey Irt
Create a Home Valuation Report for This Property
The Home Valuation Report is an in-depth analysis detailing your home's value as well as a comparison with similar homes in the area
Purchase History
| Date | Buyer | Sale Price | Title Company |
|---|---|---|---|
| Fahey Roberta J | -- | -- | |
| Fahey Roberta J | -- | -- | |
| Fahey Joan L | -- | -- | |
| Fahey Roberta J | -- | -- | |
| Joan L Fahey Irt | -- | -- |
Source: Public Records
Tax History
| Year | Tax Paid | Tax Assessment Tax Assessment Total Assessment is a certain percentage of the fair market value that is determined by local assessors to be the total taxable value of land and additions on the property. | Land | Improvement |
|---|---|---|---|---|
| 2025 | $5,275 | $435,600 | $146,400 | $289,200 |
| 2024 | $5,217 | $434,000 | $146,400 | $287,600 |
| 2023 | $5,215 | $401,800 | $111,500 | $290,300 |
| 2022 | $4,987 | $357,000 | $101,400 | $255,600 |
| 2021 | $4,772 | $329,100 | $95,900 | $233,200 |
| 2020 | $4,490 | $296,400 | $91,900 | $204,500 |
| 2019 | $4,485 | $288,600 | $86,200 | $202,400 |
| 2018 | $4,274 | $266,100 | $86,200 | $179,900 |
| 2017 | $3,793 | $235,600 | $86,200 | $149,400 |
| 2016 | $3,653 | $210,400 | $82,300 | $128,100 |
| 2015 | $3,672 | $202,300 | $82,300 | $120,000 |
| 2014 | $3,537 | $195,100 | $82,300 | $112,800 |
Source: Public Records
Map
Nearby Homes
Your Personal Tour Guide
Ask me questions while you tour the home.