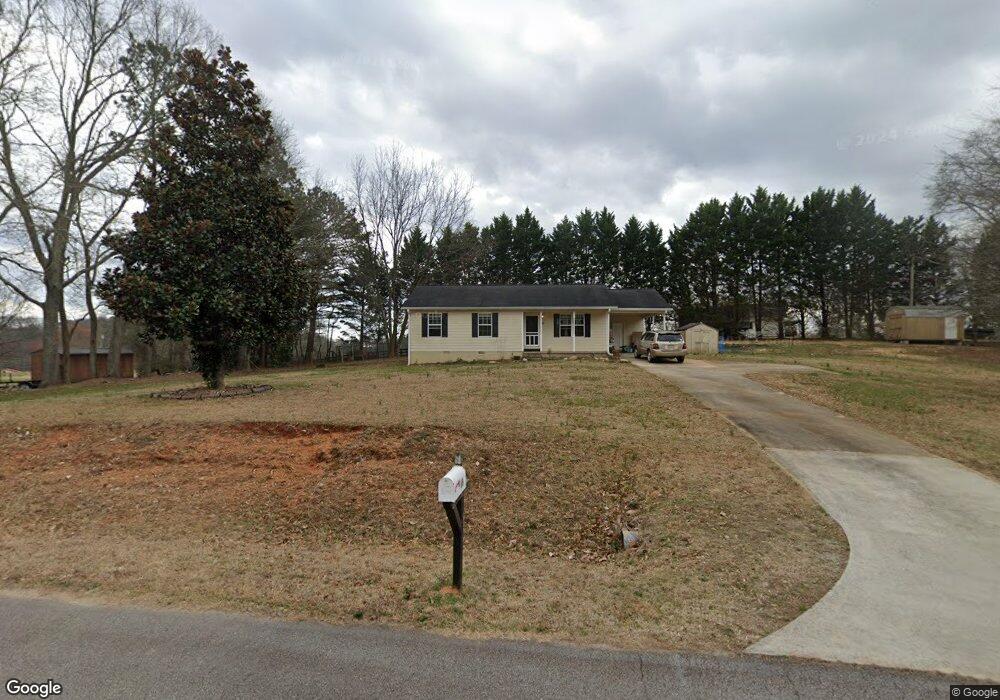
68 Terrell Rd Temple, GA 30179
Abilene NeighborhoodEstimated Value: $119,000 - $199,140
3
Beds
2
Baths
1,146
Sq Ft
$147/Sq Ft
Est. Value
About This Home
This home is located at 68 Terrell Rd, Temple, GA 30179 and is currently estimated at $168,535, approximately $147 per square foot. 68 Terrell Rd is a home located in Carroll County with nearby schools including Sharp Creek Elementary School, Temple Middle School, and Temple High School.
Ownership History
Date
Name
Owned For
Owner Type
Purchase Details
Closed on
May 9, 2017
Sold by
Ott Jace
Bought by
Dynasty Properties Llc
Current Estimated Value
Home Financials for this Owner
Home Financials are based on the most recent Mortgage that was taken out on this home.
Original Mortgage
$59,500
Interest Rate
4.23%
Mortgage Type
New Conventional
Purchase Details
Closed on
Apr 24, 2017
Sold by
Karr Melba
Bought by
Ott Jace and Ott Kelly
Home Financials for this Owner
Home Financials are based on the most recent Mortgage that was taken out on this home.
Original Mortgage
$59,500
Interest Rate
4.23%
Mortgage Type
New Conventional
Purchase Details
Closed on
Jul 13, 2012
Sold by
Karr Joshua L
Bought by
Karr Joshua L
Purchase Details
Closed on
Dec 11, 2008
Sold by
Karr Roy B
Bought by
Karr Joshua L
Purchase Details
Closed on
Feb 5, 2008
Sold by
Durbin Reed
Bought by
Karr Roy B
Purchase Details
Closed on
Apr 30, 1998
Sold by
Karr Roy R
Bought by
Durbin Reed and Durbin Donna
Purchase Details
Closed on
Apr 28, 1986
Sold by
Karr Joshua L
Bought by
Karr Joshua L
Create a Home Valuation Report for This Property
The Home Valuation Report is an in-depth analysis detailing your home's value as well as a comparison with similar homes in the area
Home Values in the Area
Average Home Value in this Area
Purchase History
| Date | Buyer | Sale Price | Title Company |
|---|---|---|---|
| Dynasty Properties Llc | -- | -- | |
| Ott Jace | $70,000 | -- | |
| Karr Joshua L | -- | -- | |
| Karr Joshua L | $100,000 | -- | |
| Karr Roy B | $3,000 | -- | |
| Durbin Reed | $51,500 | -- | |
| Karr Joshua L | -- | -- |
Source: Public Records
Mortgage History
| Date | Status | Borrower | Loan Amount |
|---|---|---|---|
| Closed | Ott Jace | $59,500 |
Source: Public Records
Tax History
| Year | Tax Paid | Tax Assessment Tax Assessment Total Assessment is a certain percentage of the fair market value that is determined by local assessors to be the total taxable value of land and additions on the property. | Land | Improvement |
|---|---|---|---|---|
| 2025 | $1,202 | $53,748 | $6,119 | $47,629 |
| 2024 | $1,216 | $53,748 | $6,119 | $47,629 |
| 2023 | $1,216 | $48,308 | $4,896 | $43,412 |
| 2022 | $955 | $38,069 | $3,264 | $34,805 |
| 2021 | $833 | $32,481 | $2,611 | $29,870 |
| 2020 | $749 | $29,179 | $2,374 | $26,805 |
| 2019 | $703 | $27,160 | $2,374 | $24,786 |
| 2018 | $613 | $23,338 | $1,350 | $21,988 |
| 2017 | $615 | $23,338 | $1,350 | $21,988 |
| 2016 | $615 | $23,338 | $1,350 | $21,988 |
| 2015 | $672 | $28,010 | $2,863 | $25,147 |
| 2014 | $674 | $28,010 | $2,863 | $25,147 |
Source: Public Records
Map
Nearby Homes
- 1249 Center Point Rd
- 124 Meadowview Dr
- 118 Meadowview Dr Unit 9
- 116 Meadowview Dr
- 122 Meadowview Dr
- 118 Meadowview Dr
- 113 Meadowview Dr
- 120 Meadowview Dr Unit 10
- 120 Meadowview Dr
- 114 Meadowview Dr Unit 7
- 124 Meadowview Dr Unit 12
- 114 Meadowview Dr
- 122 Meadowview Dr Unit 11
- 126 Meadowview Dr
- 317 Brook Ct
- 550 Harmon Rd
- 501 Grace Ct
- 365 Lovell Rd
- 0 Mountain View Cir Unit 7741132
- 0 Mt View Cir Unit 11685541
- 1355 Center Point Rd
- 102 Terrell Rd
- 75 Terrell Rd
- 65 Terrell Rd
- 95 Terrell Rd
- 1339 Center Point Rd
- 1374 Center Point Rd
- 1405 Center Point Rd
- 1306 Center Point Rd
- 21 Terrell Rd
- 21 Terrell Rd
- 1447 Center Point Rd
- 1461 Center Point Rd
- 1225 Center Point Rd
- 61 Oak Grove Rd
- 1481 Center Point Rd
- 1481 Center Point Rd
- 51 Oak Grove Rd
- 1478 Center Point Rd
- 0 Lovell Rd
Your Personal Tour Guide
Ask me questions while you tour the home.