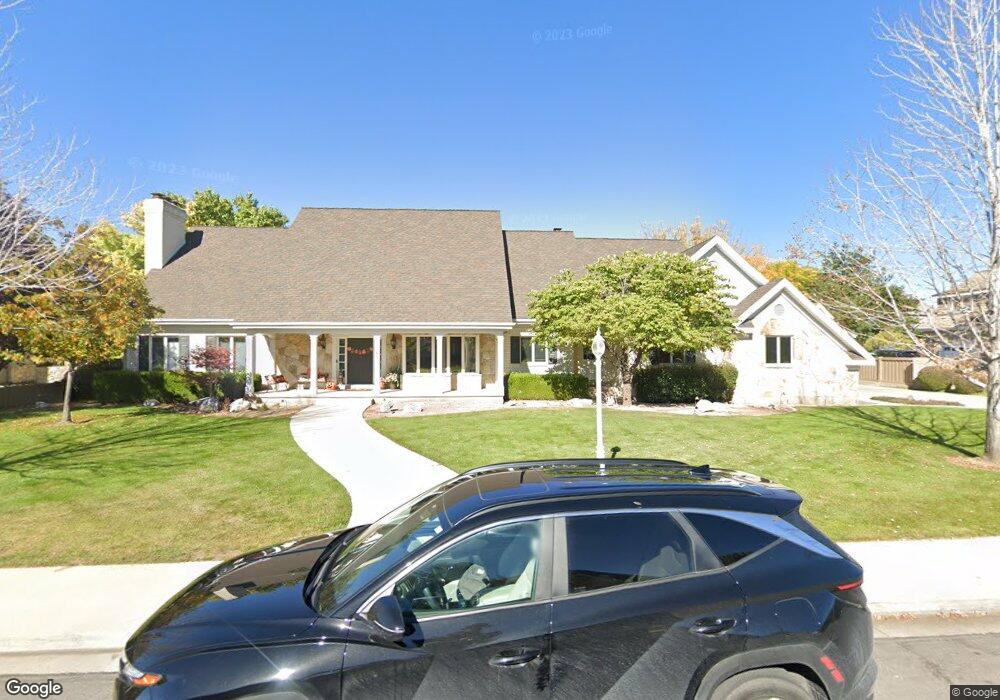
68 W 620 S Orem, UT 84058
Orem South NeighborhoodEstimated Value: $1,336,000 - $1,771,000
6
Beds
6
Baths
7,980
Sq Ft
$191/Sq Ft
Est. Value
About This Home
This home is located at 68 W 620 S, Orem, UT 84058 and is currently estimated at $1,524,730, approximately $191 per square foot. 68 W 620 S is a home located in Utah County with nearby schools including Westmore Elementary School, Lakeridge Jr High School, and Mountain View High School.
Ownership History
Date
Name
Owned For
Owner Type
Purchase Details
Closed on
Jul 11, 2024
Sold by
Nielsen David T and Nielsen Bonnie B
Bought by
Nielsen Bonnie B
Current Estimated Value
Purchase Details
Closed on
Sep 29, 2016
Sold by
Swim Lauralyn B and Lauralyn B Swim Family Living
Bought by
Nielsen David T and Nielsen Bonnie B
Home Financials for this Owner
Home Financials are based on the most recent Mortgage that was taken out on this home.
Original Mortgage
$315,000
Interest Rate
3.43%
Mortgage Type
New Conventional
Purchase Details
Closed on
Mar 31, 2005
Sold by
Swim Lauralyn B and Gaylork K Swim Family Living T
Bought by
Swim Lauralyn B and Lauralyn B Swim Family Living
Purchase Details
Closed on
Nov 23, 2004
Sold by
Swim Gaylord K and Swim Lauralyn B
Bought by
Swim Gaylord K and Swim Lauralyn B
Create a Home Valuation Report for This Property
The Home Valuation Report is an in-depth analysis detailing your home's value as well as a comparison with similar homes in the area
Home Values in the Area
Average Home Value in this Area
Purchase History
| Date | Buyer | Sale Price | Title Company |
|---|---|---|---|
| Nielsen Bonnie B | -- | Utah First Title | |
| Nielsen David T | -- | Northwest Title Ins Agency | |
| Swim Lauralyn B | -- | -- | |
| Swim Gaylord K | -- | -- |
Source: Public Records
Mortgage History
| Date | Status | Borrower | Loan Amount |
|---|---|---|---|
| Previous Owner | Nielsen David T | $315,000 |
Source: Public Records
Tax History
| Year | Tax Paid | Tax Assessment Tax Assessment Total Assessment is a certain percentage of the fair market value that is determined by local assessors to be the total taxable value of land and additions on the property. | Land | Improvement |
|---|---|---|---|---|
| 2025 | $5,211 | $745,745 | -- | -- |
| 2024 | $5,211 | $637,175 | $0 | $0 |
| 2023 | $4,735 | $622,270 | $0 | $0 |
| 2022 | $4,478 | $570,130 | $0 | $0 |
| 2021 | $4,329 | $834,800 | $226,300 | $608,500 |
| 2020 | $4,096 | $776,300 | $196,800 | $579,500 |
| 2019 | $3,615 | $712,400 | $196,800 | $515,600 |
| 2018 | $3,561 | $670,500 | $154,900 | $515,600 |
| 2017 | $3,542 | $357,280 | $0 | $0 |
| 2016 | $3,755 | $349,305 | $0 | $0 |
| 2015 | $3,971 | $349,305 | $0 | $0 |
| 2014 | $3,758 | $329,065 | $0 | $0 |
Source: Public Records
Map
Nearby Homes
Your Personal Tour Guide
Ask me questions while you tour the home.