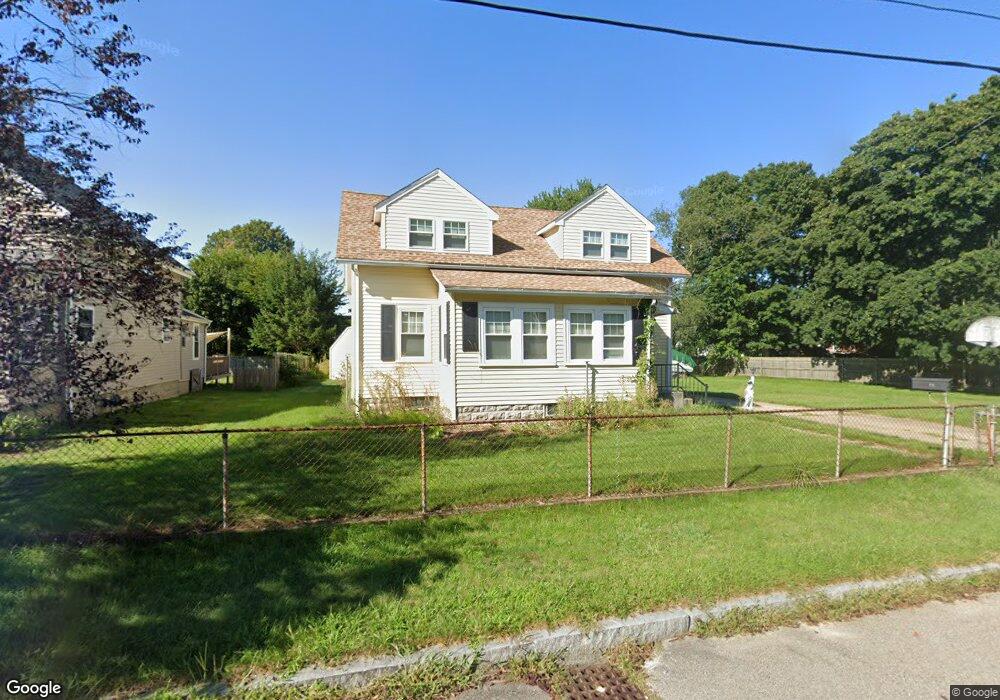
68 Winslow St Riverside, RI 02915
Riverside NeighborhoodEstimated Value: $464,370 - $501,000
3
Beds
2
Baths
1,464
Sq Ft
$333/Sq Ft
Est. Value
About This Home
This home is located at 68 Winslow St, Riverside, RI 02915 and is currently estimated at $486,843, approximately $332 per square foot. 68 Winslow St is a home located in Providence County with nearby schools including East Providence High School, St Luke Elementary School, and St Mary Academy-Bay View.
Ownership History
Date
Name
Owned For
Owner Type
Purchase Details
Closed on
Jan 23, 2015
Sold by
Looney Richard S
Bought by
Looney Richard S and Looney Sheila M
Current Estimated Value
Purchase Details
Closed on
Jun 29, 2012
Sold by
Richard H Looney Ret
Bought by
Looney Richard S
Create a Home Valuation Report for This Property
The Home Valuation Report is an in-depth analysis detailing your home's value as well as a comparison with similar homes in the area
Home Values in the Area
Average Home Value in this Area
Purchase History
| Date | Buyer | Sale Price | Title Company |
|---|---|---|---|
| Looney Richard S | -- | -- | |
| Looney Richard S | -- | -- | |
| Looney Richard S | -- | -- |
Source: Public Records
Mortgage History
| Date | Status | Borrower | Loan Amount |
|---|---|---|---|
| Closed | Looney Richard S | $135,000 |
Source: Public Records
Tax History
| Year | Tax Paid | Tax Assessment Tax Assessment Total Assessment is a certain percentage of the fair market value that is determined by local assessors to be the total taxable value of land and additions on the property. | Land | Improvement |
|---|---|---|---|---|
| 2025 | $5,616 | $429,700 | $141,100 | $288,600 |
| 2024 | $5,571 | $363,400 | $117,500 | $245,900 |
| 2023 | $5,364 | $363,400 | $117,500 | $245,900 |
| 2022 | $4,892 | $223,800 | $68,500 | $155,300 |
| 2021 | $4,812 | $223,800 | $63,200 | $160,600 |
| 2020 | $4,608 | $223,800 | $63,200 | $160,600 |
| 2019 | $4,480 | $223,800 | $63,200 | $160,600 |
| 2018 | $4,363 | $190,700 | $61,700 | $129,000 |
| 2017 | $4,266 | $190,700 | $61,700 | $129,000 |
| 2016 | $4,245 | $190,700 | $61,700 | $129,000 |
| 2015 | $3,927 | $171,100 | $57,200 | $113,900 |
| 2014 | $3,927 | $171,100 | $57,200 | $113,900 |
Source: Public Records
Map
Nearby Homes
- 25 Winslow St
- 99 Allen Ave
- 103 Burnside Ave
- 15 Plaza Dr
- 85 Hilton Ave
- 25 Arnold St
- 15 Claire St
- 35 E Knowlton St
- 151 Willett Ave Unit 2
- 151 Willett Ave Unit 5
- 23 Albert Ave
- 10 Booth Ave
- 2 Leigh Ln
- 33 Pine St Unit 35
- 6 Hazelton Rd
- 72 Stowe Ave
- 28 Jefferson Ave
- 65 Estrell Dr
- 41 White Ave
- 45 Washington Rd
Your Personal Tour Guide
Ask me questions while you tour the home.